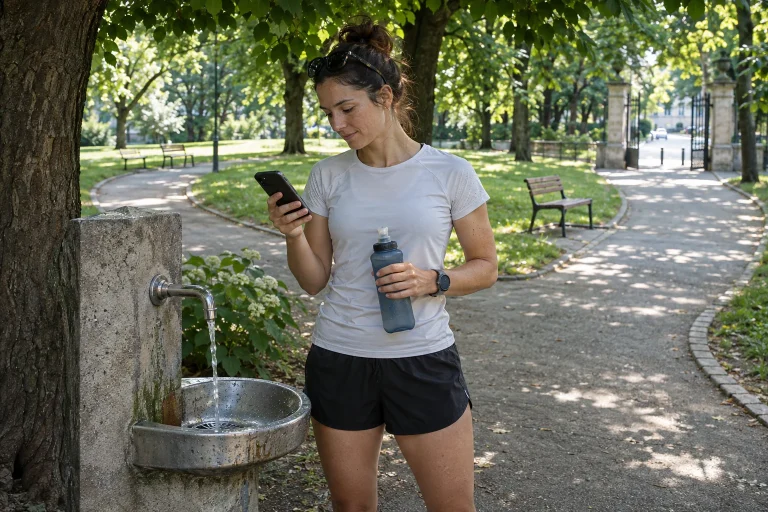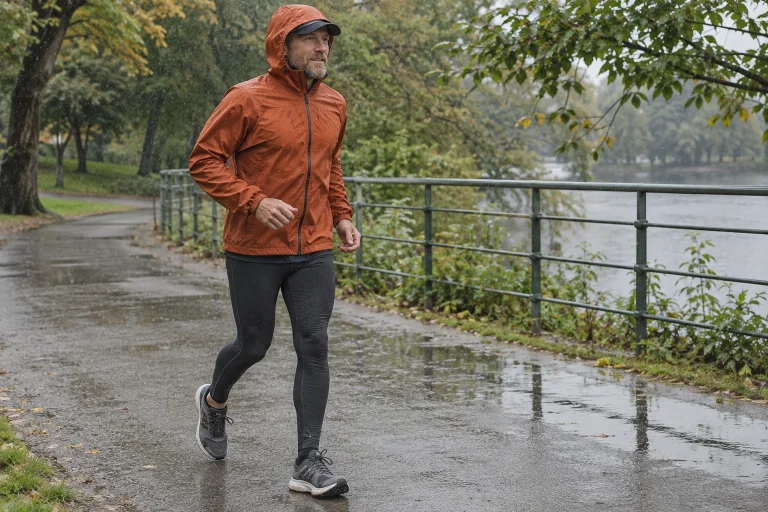
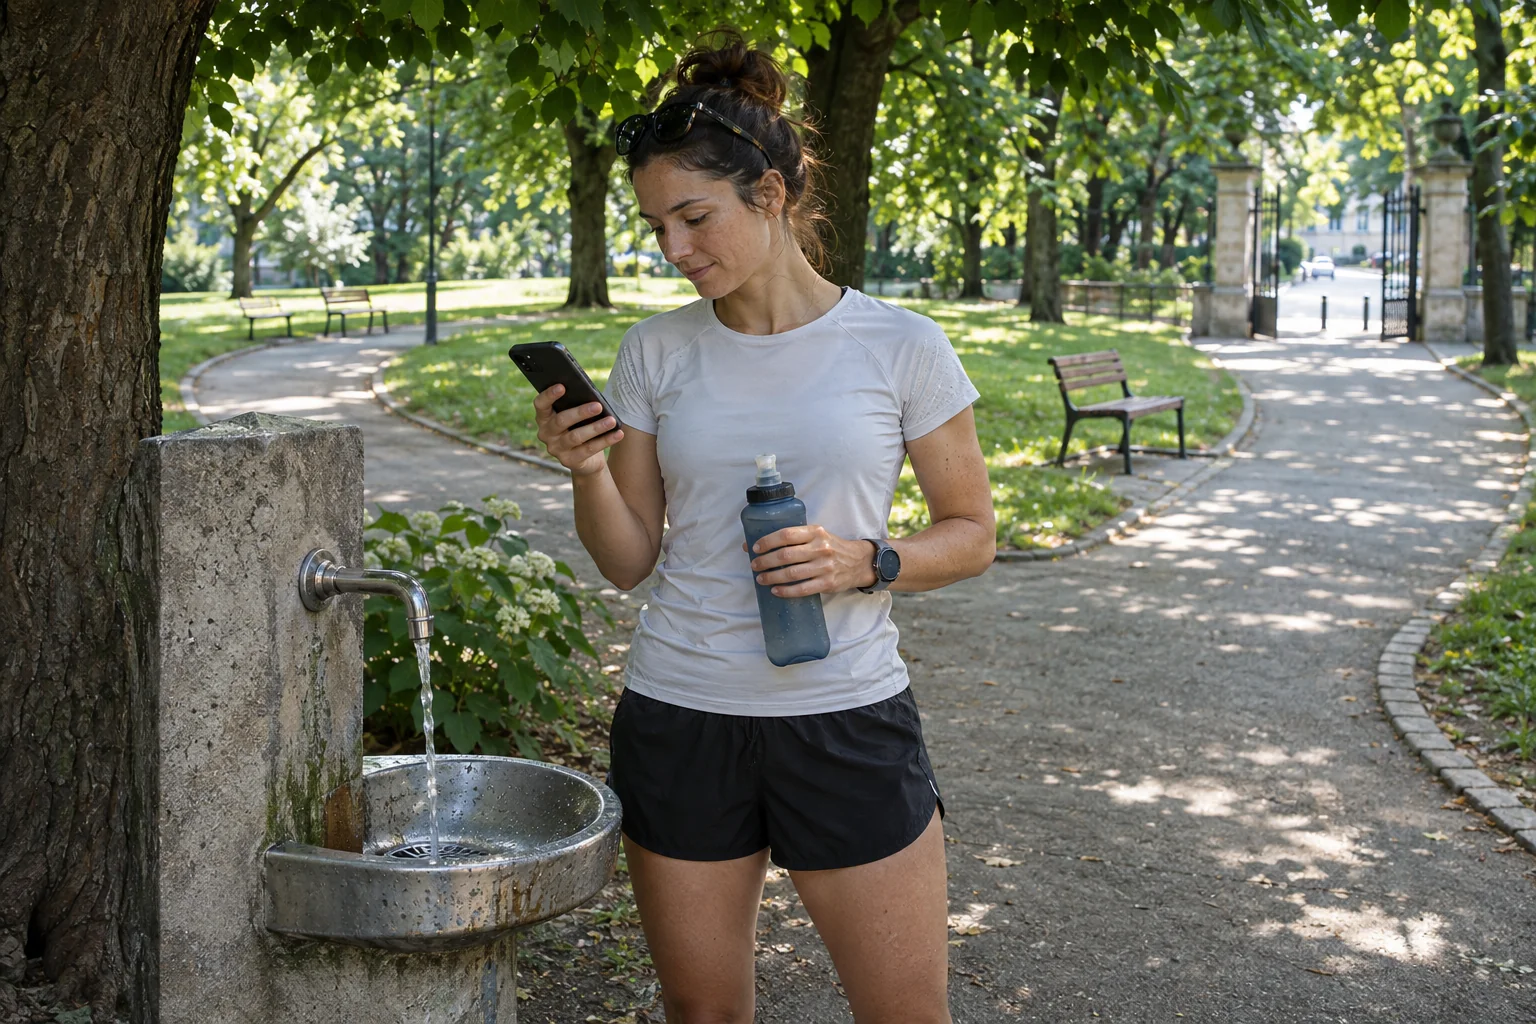
One morning you see ninety per cent humidity, yet jogging feels easy. Another time the phone shows only fifty per cent, but the warm air feels much more muggy. These experiences are not inherently contradictory. Relative humidity’s percentage must be interpreted with temperature; it does not represent the same amount of water vapour in all conditions. Dew point describes the air’s moisture state from another perspective.
This guide teaches you to read the two fields using original, checked numerical examples. We provide no compulsory pace or fluid dose calculated from one dew point. The aim is to avoid choosing running conditions from the apparently more favourable percentage and confusing outdoor air with the environment under your jacket. The teaching calculations concern fictional situations, not today’s station observations.
What is relative humidity relative to?
The UK’s National Physical Laboratory defines relative humidity as actual water-vapour pressure divided by the saturation value at that temperature and pressure, expressed as a percentage. In brief, RH = 100 × e / es. The denominator is not constant: saturation vapour pressure changes with temperature. Water-vapour pressure here is a partial pressure, not the total air-pressure value on weather maps.
For everyday reading, one important question remains: alongside which temperature is the percentage shown? Omitting that from a message gives another runner incomplete information. ‘Humidity will be lower tomorrow’ does not establish a more favourable heat load for the outing. It may simultaneously be much warmer, sunshine may change or you may choose another route.
Precipitation probability is also a separate field. Ninety per cent relative humidity is not a ninety per cent chance of rain, nor rain for ninety per cent of the workout. An app may display several percentages together. Identify the label first: are you discussing relative humidity, cloud cover or precipitation probability? A shared symbol does not make quantities identical.
Dew point is a temperature, but not the expected daily minimum
Meteorological dew point describes the temperature to which air would need cooling to become saturated at a given pressure and unchanged moisture conditions. The NWS explains that a higher dew point indicates more atmospheric moisture, making it a useful addition for judging mugginess compared with relative humidity alone. It is still not a heat-load index for the whole environment or a direct measurement of a runner’s sweating.
The conditional wording matters: dew point does not predict that the area will actually cool to that temperature by evening. It is neither a daily minimum forecast nor the temperature promised at the start. If, for example, you see air at twenty degrees and a dew point of fifteen, the numbers name different quantities. Do not add them; their difference is not a percentage to subtract from training time either.
Distinguish dew point from wet-bulb temperature too. The Met Office describes the latter as measurement using a thermometer cooled by evaporating water: a different physical definition. If a calculation requires a natural wet-bulb value, you cannot simply paste the phone’s dew-point field into it. Preserving precise names among related weather quantities matters as much as distinguishing Celsius from Fahrenheit.
 Enlarge image
An original example: ninety per cent can mean lower vapour pressure
We calculated the following example using the NPL’s Magnus approximation for saturation water-vapour pressure over liquid water. With air temperature t in Celsius: es = 611.2 × exp[17.62 × t / (243.12 + t)] pascals. We then multiplied by the relative-humidity fraction. Inputs are original teaching values; rounding does not imply instrumental measurement accuracy, and the example is not designed for freezing conditions.
| Our situation | Air and RH | Calculated water-vapour pressure | Calculated dew point |
|---|---|---|---|
| A | 10 °C and 90% | approximately 11.0 hPa | approximately 8.4 °C |
| B | 30 °C and 50% | approximately 21.2 hPa | approximately 18.4 °C |
In A, calculated saturation pressure is approximately 12.3 hPa; ninety per cent gives the result near 11.0. In B, the denominator is about 42.3 hPa, so fifty per cent still means greater actual water-vapour pressure. The table does not compare two runners’ exercise capacities. It shows why atmospheric moisture cannot be ranked solely by the displayed percentage.
If an app rounds to whole Celsius degrees or whole percentages, dew point recalculated from them may not match the provider’s own field to a tenth. The relationship used, input precision and rounding all matter. A difference of a couple of tenths should not automatically become a device fault. First check whether location, time, unit and data source match.
What happens to the percentage if dew point stays the same?
In another original calculation, keep dew point at 15 °C. The same relationship gives relative humidity of approximately 73 per cent at air temperature of 20 °C and approximately 40 per cent at 30 °C. This illustrates a relationship under constant moisture and identical pressure conditions, not all atmospheric changes across a particular day. The lower percentage did not require selecting a lower dew point.
Our planning conclusion is that lower afternoon RH alone is insufficient reason to reject the morning option. The example selected warmer afternoon air; the percentage decrease does not itself mean cooler conditions. Compare actual times through forecast temperature, moisture, sunshine and airflow together. A dew point held fixed on paper does not guarantee it stays constant in reality.
A useful note might contain complete data on two lines, for example morning and afternoon options with their providers and valid times. Do not circle only the lowest humidity percentage. Add which time allows a shadier loop, a companion or an easy way to stop. These organisational factors cannot be read directly from either moisture field.
Evaporation potential is not the same as visible sweat
High moisture in warm air can impede sweat evaporation and thus heat loss from the body; the Met Office heat information highlights this too. A visibly wet shirt is not an independent environmental instrument, however. Moisture on the body or retained in fabric cannot uniquely reveal outdoor RH, and visual inspection alone cannot establish total heat load.
NWS information on WBGT therefore considers several factors: radiation and airflow alongside temperature and moisture. Dew point provides useful additional information but does not summarise all of them. The same dew point does not make a short shaded park loop identical to a sunny route that cannot easily be interrupted for longer. The whole outing still needs planning.
To understand a warm run better, record several separate observations. How sheltered was the route? Were there stops? How much of your torso did a jacket or vest cover? These do not automatically produce a laboratory heat balance, but give a more precise story than ‘it went badly at fifty per cent’. Retaining moisture data helps when conditions are not erased from the log too.
Conditions under a jacket may differ from those at a station
The public summary of ISO 11092:2026 describes testing material thermal and water-vapour resistance under steady-state conditions. It specifically states that test conditions do not represent a particular comfort situation. Such a material value is therefore neither your personal humidity measured inside a whole jacket while running nor a guaranteed comfort rating. We use only this testing context from the standard’s public description here.
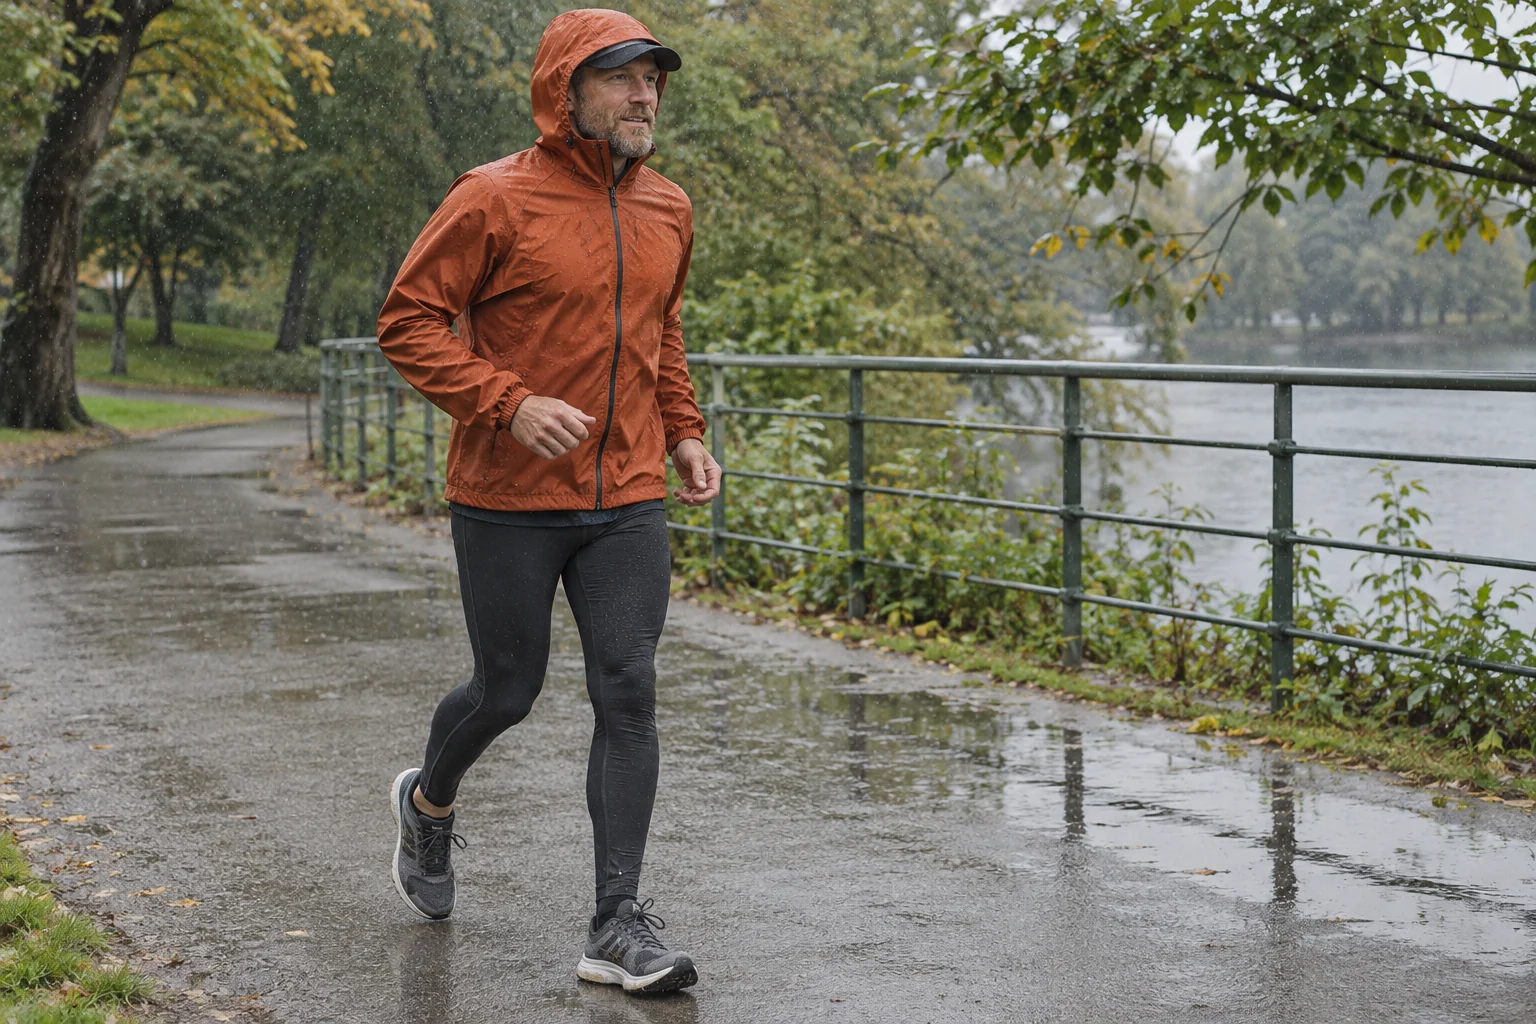
For a practical example, imagine a changeable spring loop. Rain prompts you to put on an outer layer at the start; later it stops, but the jacket stays closed. Outdoor moisture data do not reveal conditions between your layers. In your log, separate weather data from clothing events: when did you put on, unzip or put away the jacket? This is more traceable than attributing all moisture to the app’s percentage.
Handling the hood, backpack, vest and pockets also belongs to your setup. Name what you changed in your notes. If you simultaneously choose a new jacket, different inner layer and another route, a changed experience cannot be attributed cleanly to one material. A purchasing conclusion is better supported by precise, condition-specific experience than judging a brand or material family from one unsuccessful loop.
 Enlarge image
A dew-point threshold is not individual medical clearance
The CDC lists dizziness, headache, weakness and nausea among heat-related symptoms and calls for particular attention with some chronic conditions, pregnancy or older age. If individual risk applies, discuss exertion in heat with your treating clinician. Do not solve it by changing medicines yourself or following an online dew-point table. A moisture range described as favourable does not exclude illness.
Confusion, seizures or loss of consciousness may indicate serious heat illness; NIOSH notes that heatstroke can occur with heavy sweating. In Hungary, seek emergency help through 112, stop exertion, begin cooling and follow the emergency dispatcher’s instructions. Do not wait for displayed humidity or dew point to reach an arbitrarily chosen threshold. The symptomatic person’s condition matters more than a favourable screen colour.
This article does not aim to create a fluid-intake formula either. Atmospheric water-vapour content alone does not reveal a runner’s sweat loss or required drinking amount. If advice assigns everyone the same litres per hour from one dew point, ask how personal differences are handled. Understanding moisture data and individual fuelling-and-hydration planning are related but separate tasks.
Turning two weather fields into a useful running log
Read air temperature, relative humidity and dew point together when all three are available. Add location, time and data type. If dew point is missing, mark it missing; do not give a log false precision through a site using an unknown formula. For your own calculations, name the method and rounded inputs separately.
When arranging the next group run, one simple sentence may suffice: ‘Let us compare morning and afternoon using the full weather data, not only humidity percentage.’ Then discuss actual choices: when are you available, which routes do you know and where can you stop or shorten the outing? Meteorological fields contribute when they make this conversation clearer rather than becoming further puzzles to decode.
Looking back, ask more than which number was high. Identify which information genuinely helped a decision: timing, exposed-section length, handling clothing or changing the shared programme. Dew point and relative humidity then take their proper place as useful descriptions of the environment, without either becoming a universal running-pace command.
Sources and calculation context
Checked: 21 November 2026. The two table situations and constant 15 °C dew-point example are original calculations using the NPL Magnus approximation over liquid water. Clothing and organisational situations are original teaching examples; no original physiological measurement or documented medical review is claimed.
- National Physical Laboratory: How do I convert between dew point and relative humidity? – definitions and relationships
- NWS La Crosse: Dew Point vs. Humidity
- Met Office: Understanding humidity – humidity and wet-bulb temperature
- NWS Wichita: WBGT and heat index – interpreting several environmental factors together
- ISO 11092:2026 – public material-test description and its comfort limitation
- CDC: About Heat and Your Health
- NIOSH: Heat-related Illnesses
How Futószív articles are prepared: our editorial guidelines.