Two trail races list the same distance beside their names yet promise very different days. One undulates along wide woodland tracks; the other starts with a long climb and ends on a rocky, narrow descent. Kilometres matter, but are insufficient to understand which activity fits your experience and goals. Adding total ascent provides more information, yet technical character and course structure still cannot be reduced to one number.
Comparison is not about deciding which race is universally tougher. Look for differences, which are familiar to you and which need further information. This guide is not a personalised suitability assessment or finish-time prediction. It helps you read course information and connect it with your own experience.
Compare the same kinds of information
First identify the particular year and race. A festival may offer several distances, and a number in a creative race name may not match the detailed route every year. Find the organiser’s current course page and downloadable material. If the name says twenty kilometres but the updated description gives a different measured distance, state which figure you use in the comparison.
For elevation, check whether the figure means total ascent or another summary. Metres climbed and descended are not the same information, and their combined total cannot be treated unchanged as positive elevation gain. If the source is unclear, ask or leave it open. Similar units do not automatically make figures comparable.
Measurement methods can also create differences. An organiser’s figure, your watch recording and another app’s recalculated profile may not give identical results. Avoid inconsistent selection: choosing the smallest figure found for one event and the largest for another can easily distort the picture. A source and checking date are useful alongside the number.
Keep the kilometre-effort calculation in perspective
The ITRA organiser information calculates kilometre-effort by adding one hundredth of total ascent in metres to distance in kilometres. The World Athletics Technical Rules effective from 1 July 2026 also explain the calculation. This creates a simple common indicator from two course measurements. It does not automatically predict your time, and the formula does not include every technical or weather difference. Do not interpret the result as actual flat kilometres or a personal training prescription.
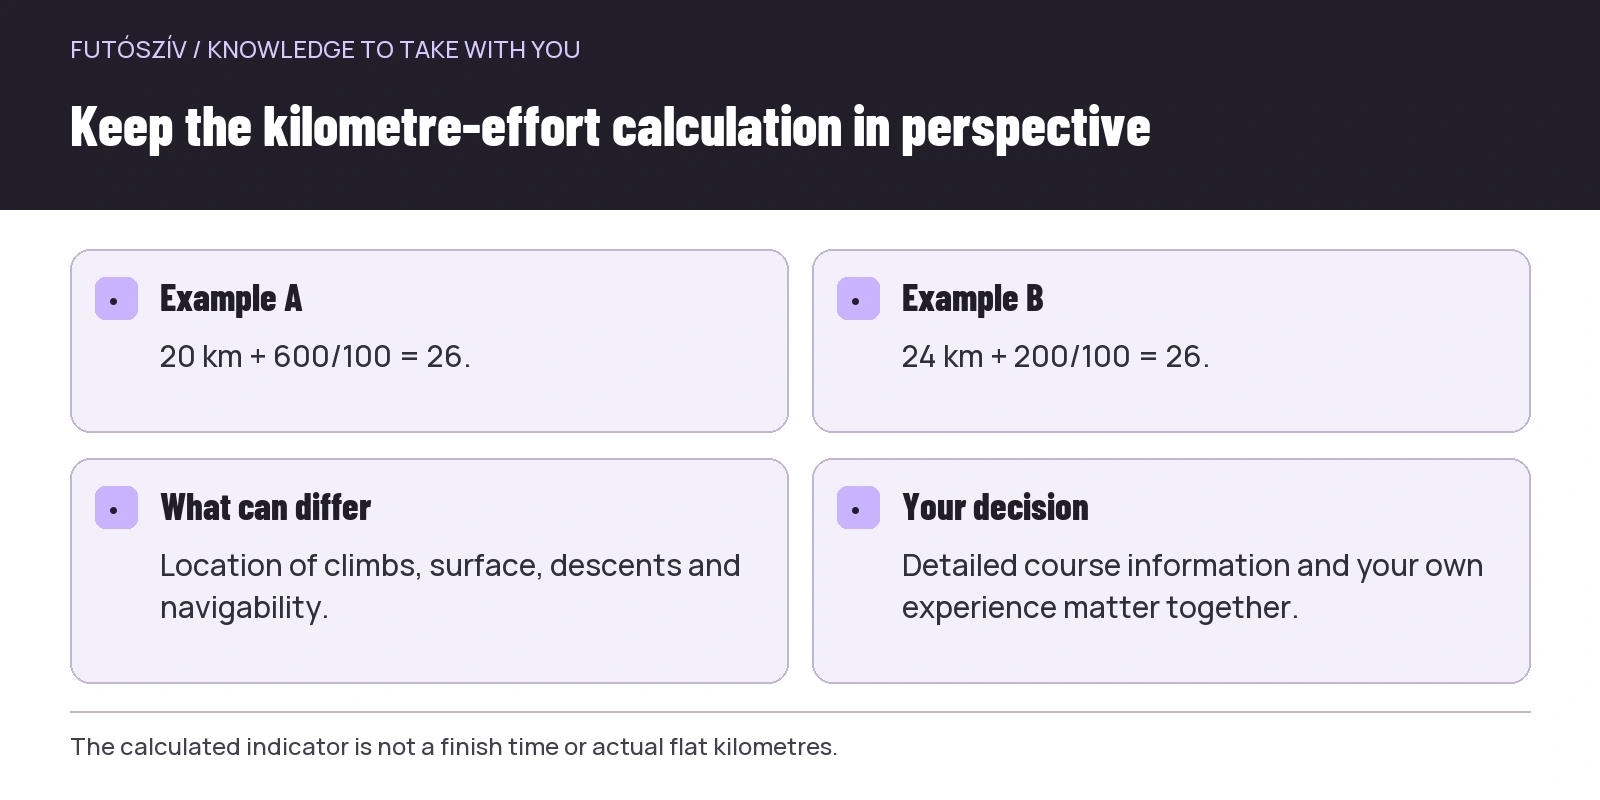
Here is a fictional example, not real race data. Route A is 20 kilometres with 600 metres of ascent: 20 + 600/100 = 26 kilometre-effort. Route B is 24 kilometres with 200 metres of ascent: 24 + 200/100 = 26. Their indicator matches, but the courses have not become identical in length, steepness or navigability. Read the detailed descriptions further to understand the differences.
The official explanation of the UTMB World Series sporting system also organises events into categories. A category label is not a complete technical course description. It helps locate the event within a system, but your decision needs the actual details and conditions of the particular race. Similar categories do not mean similar days in every respect.
 Enlarge diagram
Text version of the diagram
- Example A
- 20 km + 600/100 = 26.
- Example B
- 24 km + 200/100 = 26.
- What can differ
- Location of climbs, surface, descents and navigability.
- Your decision
- Detailed course information and your own experience matter together.
Read where the ascent lies on the profile
The same total ascent can describe different courses. There may be many short rises, one longer continuous climb or two larger climbs in different parts. A profile helps explain where movement changes, but inspect its vertical and horizontal scales too. Two differently drawn profiles may not be comparable from appearance alone.
The position of a longer climb can affect organisational ideas too. A junction accessible early raises different questions from a later, more remote section. A descent before the finish is not automatically an easy ending either. Interpret course details in their full sequence, not merely as adjectives beside total distance and ascent.
The profile does not show everything. Camber, small stones, roots, a narrow passage or the actual view often do not appear. These may need a description, correctly dated images, organiser information or targeted familiarity with the course. Do not infer missing detail from a smooth line on a graph.
Look for concrete words describing technical terrain
Easy, moderate and difficult alone are insufficient. Ask what they mean on the course: narrow paths, loose stones, roots, steep descents, frequent changes of direction or something else? A more specific description is easier to compare with what you know. A feature resembling a familiar route is a more usable reference than an unknown writer’s general rating.
Check the length and continuity of technical sections too. A brief, clearly recognisable section differs from several consecutive kilometres over similar ground. The rest of the course matters: are there simpler sections to navigate between them, or does it demand close attention throughout? You do not need to manufacture an automatic difficulty score; describe differences clearly.
| Comparison criterion | Specific question | What cannot replace it |
|---|---|---|
| Surface | Wide woodland track, narrow path, stones, roots or loose ground? | One attractive landscape photograph |
| Climbs | Where do they appear, and in which sections? | Total ascent alone |
| Descents | How do steepness and surface combine? | Automatically calling downhill easy |
| Navigability | What are the markings like, and how frequent are route changes? | A downloadable file merely existing |
| Access | Where are verified exit and support opportunities? | A settlement appearing nearby at the map’s edge |
Race organisation belongs in the comparison too
Start time and the full programme window determine conditions when you begin and finish. A daytime, evening or night start can require different organisation, but its name alone does not rate it. Assess lighting, travel and following the course using your own experience and the organiser’s specific requirements.
Aid and checkpoint locations, time limits and mandatory equipment deserve separate lines. Do not assume similar distances mean identical provision and rules. Matching your own needs may matter more than differences between labels. If details have not yet appeared, keep that an open question in the comparison.
The relationship between start and finish matters too. A loop course and a race ending in another town may require different travel. Time and costs outside the course belong in the entry decision. Do not confuse technical course data with the total difficulty of participating: inspect both, but describe them separately.
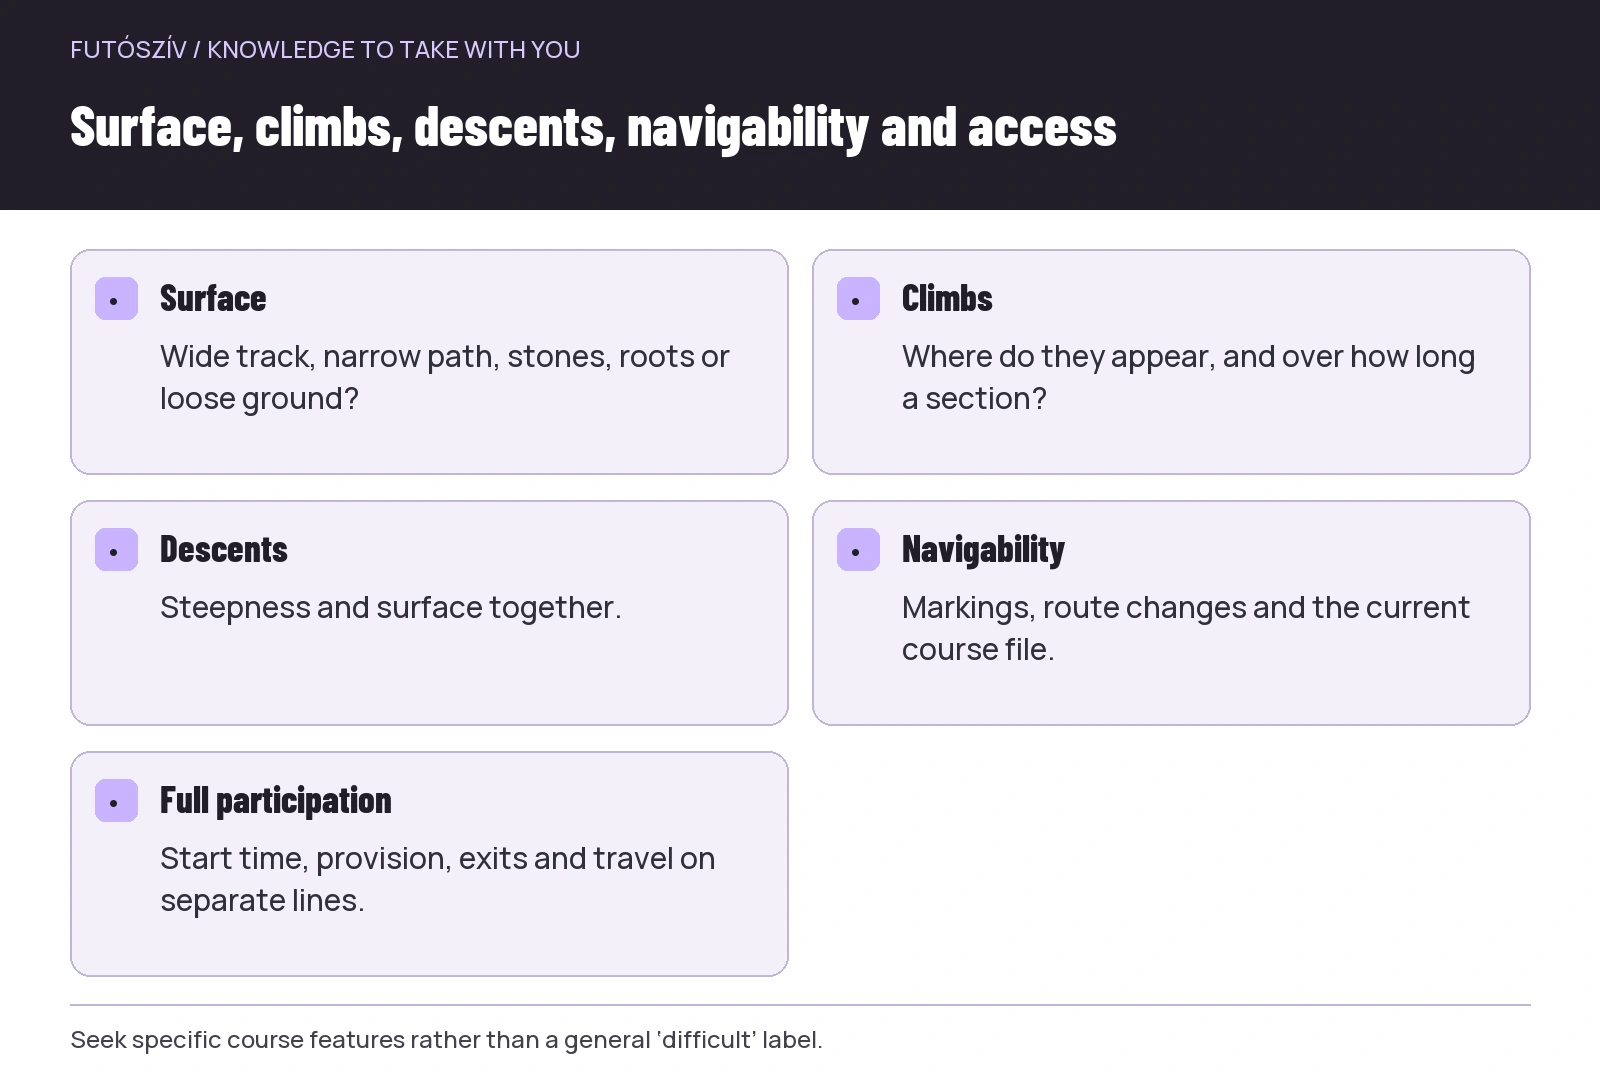 Enlarge diagram
Text version of the diagram
- Surface
- Wide track, narrow path, stones, roots or loose ground?
- Climbs
- Where do they appear, and over how long a section?
- Descents
- Steepness and surface together.
- Navigability
- Markings, route changes and the current course file.
- Full participation
- Start time, provision, exits and travel on separate lines.
Do not attach weather to the course as an average adjective
A route can pose different demands when dry and wet. A previous year’s video does not establish the weather on the next race day. For a longer-term choice, understand which conditions can change the course’s character; closer to the event, current official information and forecasts matter.
A higher or exposed section may not present the same situation as the start area. Review course variation on the map rather than describing every section from one city weather icon. This article gives no weather decision threshold; it highlights that comparing two races remains dependent on conditions.
If an activity seems manageable only under particularly favourable conditions that are still uncertain, record that separately. Attractive promotional material should not hide the condition. You do not need to quantify every risk for a good decision, but should know which unknown factor significantly influences your choice.
Create references from your own experience
Beside each important course feature, record a situation you already know: where you encountered a similar surface, how easy the route was to follow and what organisation it required. This does not make two courses identical, but shows which details you actually have experience of. The comparison then rests on more than race marketing.
Missing experience is information too. If you have never covered a similarly long technical section, do not automatically mark it suitable because the total kilometres are familiar. The next step can be focused research, appropriately arranged course familiarisation or choosing another goal. Entering does not supply knowledge that needs clarifying beforehand.
Read other runners’ reports with their circumstances. Which year, weather, distance and background do they concern? ‘It was easy for me’ is a personal assessment, not a general course property. A specifically described detail verifiable through several sources can nevertheless help frame a good question for the organiser.
A fictional comparison of two courses with the same indicator
Return to routes A and B, both with calculated kilometre-effort of 26. A is shorter, but much of its ascent belongs to one longer climb, and its descent includes a narrower, rockier section. B is longer, with smaller undulations and wider woodland tracks. These are fictional examples, not claims about real events.
For one runner, A resembles familiar terrain more closely because they have experience on that surface. For another, B may be a clearer next goal because organising and following longer, wider routes is more familiar. The shared indicator does not decide for them. Detailed course features and personal aims make the comparison meaningful together.
If one race lacks an updated technical description, they do not fill the gap with the other course’s data. They wait for or ask about the important detail. A decision sheet can state that one option is not yet fully comparable. That is more accurate than declaring a winner at any cost.
Be able to describe the difference when choosing
A good comparison does not necessarily conclude that A is two points harder. A more useful conclusion might be: B is longer, but its surface and travel match my current experience better; I still need more information about A’s technical section. This includes both the course and your circumstances without making a universal ranking.
Before final entry, recheck that the current year, race, route and conditions match. An earlier spreadsheet records your thinking; it does not guarantee a course will remain unchanged. Numbers help begin a comparison, while specific sections and conditions show what they mean for your next trail day.
How Futószív articles are prepared: our editorial guidelines.