Two loops of equal length can be very different tasks
Both routes say ten kilometres, yet one is an easily understood rolling loop and the other contains a long climb and steeper return. An elevation profile reveals part of that difference. A glance at its shape is insufficient, however: understand the axes, the distinction between total ascent and highest point, and what the chart omits.
An elevation profile is one planning tool. It is not a standalone difficulty certificate or an automatic prediction of completion time. This guide examines questions to ask before a new trail loop, how to compare the profile with a map and which conclusions should remain open.
Read the axes first
The horizontal axis usually shows distance travelled and the vertical altitude. Check every chart: a recorded activity may also use time. With time on the horizontal axis, the curve’s steepness cannot be interpreted as on a distance-based profile.
For altitude, inspect units and the scale’s starting value. A vertical range of only a few tens of metres may make small undulations look like dramatic mountains. Another display may almost erase the same changes. A pointed shape on screen is not itself numerical information.
When comparing routes, use matching or at least understood scales. Otherwise, one profile may seem steeper merely because it was drawn narrower or over a different altitude range. Decisions need numbers and section locations, not graphical drama alone.
Highest point, net elevation change and total ascent
The highest point is one location’s altitude. Start–finish elevation difference compares two points. Total ascent adds upward sections along the way under the calculation used. A loop may start and finish in the same place while containing substantial climbing.
Illustrative example: a loop starts at 200 metres, climbs to 350, descends to 250, climbs again to 350 and returns to the start. Its highest point is 350 metres, net start–finish difference zero, and simplified total ascent 150 + 100 = 250 metres. Three numbers answer three questions.
| Data | What does it tell you? | What does it not tell you alone? |
|---|---|---|
| Highest point | How high the line reaches | How many climbs you encounter |
| Start–finish elevation difference | How different the ending altitude is | The amount of work between them |
| Total ascent | The sum of uphill sections under the calculation | Climb sequence and ground |
| Total descent | The sum of downhill sections | How followable or technical the descents are |
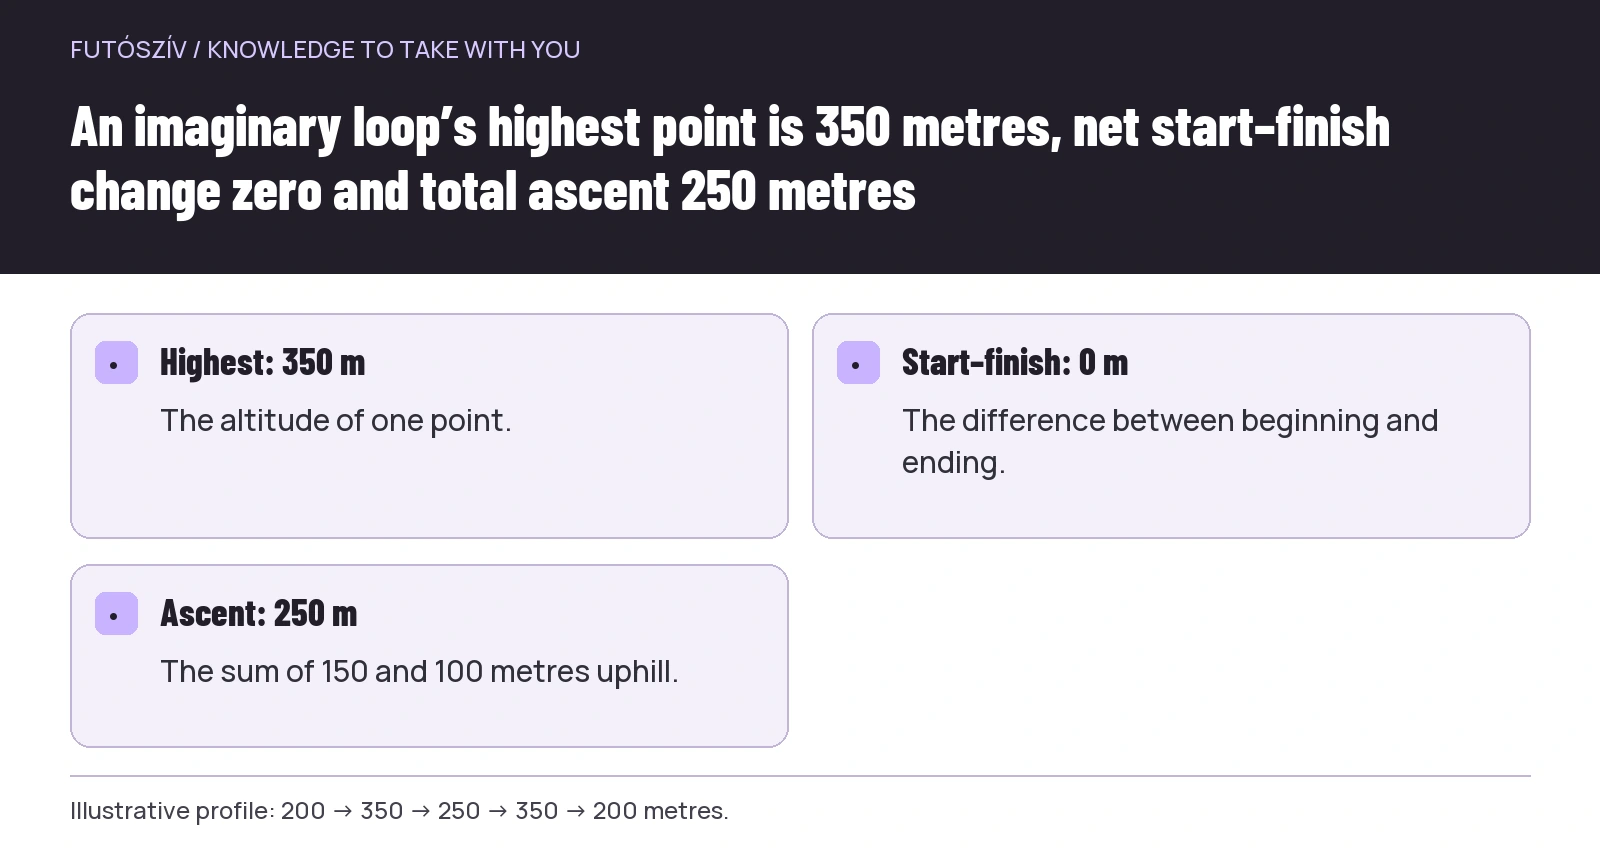 Enlarge diagram
Text version of the illustration
- Highest: 350 m
- The altitude of one point.
- Start–finish: 0 m
- The difference between beginning and ending.
- Ascent: 250 m
- The sum of 150 and 100 metres uphill.
The same ascent can be distributed differently
Three hundred metres of ascent may be one longer climb or several small undulations. The total can match while the day’s rhythm differs. Decision points, navigation and the return occur in another order, with exit options attached to different sections.
When reading a profile, mark where each continuous climb begins and ends. Examine the distance over which the height change happens and its place within the full route. A late climb raises a different planning question from the same shape immediately after the start.
Do not use a universal conversion saying this ascent equals “exactly this many extra kilometres”. Such simplification can at most belong to a specified method with known conditions. Your own planning also needs ground, routing, experience and current conditions beside distance and ascent.
What does percentage gradient mean?
In a simple mapping approximation, height change divided by horizontal distance gives percentage gradient. Climbing 100 metres over 1,000 horizontal metres averages 10 per cent. Spreading the same 100 metres over 5,000 gives 2 per cent. These are original calculations explaining the concept.
The average does not describe every local part. A climb averaging ten per cent can contain gentler and steeper sections. Apps may use different calculations and distance concepts, so read your system’s explanation. Do not treat the steepest instantaneous value as a terrain measurement with unlimited precision either.
Percentage is not degrees. If a route is described once in per cent and elsewhere in degrees, the figures cannot simply replace each other. Ask when the unit is unclear. Planning needs no complex trigonometry, but misunderstanding the unit can substantially distort your expectations.
Read the profile with the map
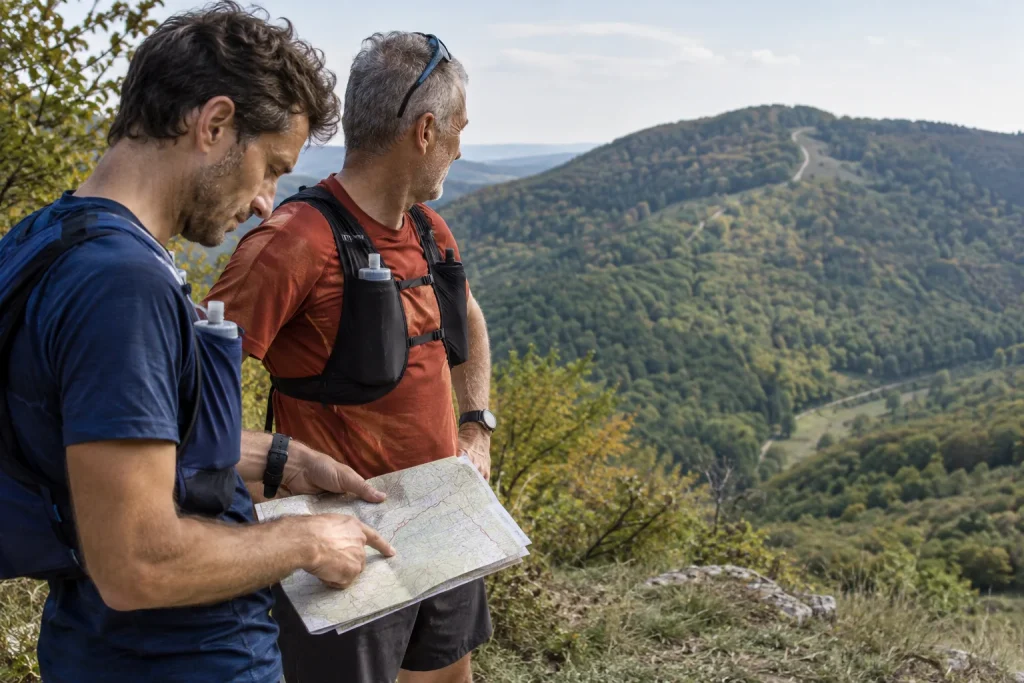
The curve shows height along a line, but offers limited context. On the map, examine the climb’s route, marked paths, junctions and nearby return options genuinely available. The two views complement one another.
The Ordnance Survey educational page on contour lines illustrates that closer contours indicate steeper slopes. Learn the contour interval from the map legend too. Their spacing then creates an intelligible connection between profile and terrain shape.
If the profile shows a long climb, inspect which path the track follows on the map. Elevation does not say whether it is a wide forest track, narrow trail or steps. Suitable map symbols, reliable route descriptions and local information where needed provide that detail.
Why can apps show different ascent totals?
Source and processing matter. A recorded activity and a planned route created from it may show different values. The Garmin course-creation support page explains, for example, that converting an activity to a course may use a digital elevation model, changing summed ascent and descent.
This does not mean the smaller or larger number is always true. First examine the source and operation that produced it. If two services differ, retain the difference with sources identified. Treat it as planning uncertainty rather than choosing for convenience.
A profile showing several large narrow spikes over a short distance can also be suspicious when the map and reliable description suggest no such terrain. This requires data checking. Do not automatically invent a difficulty category from spikes or delete them without thought because they look too large.
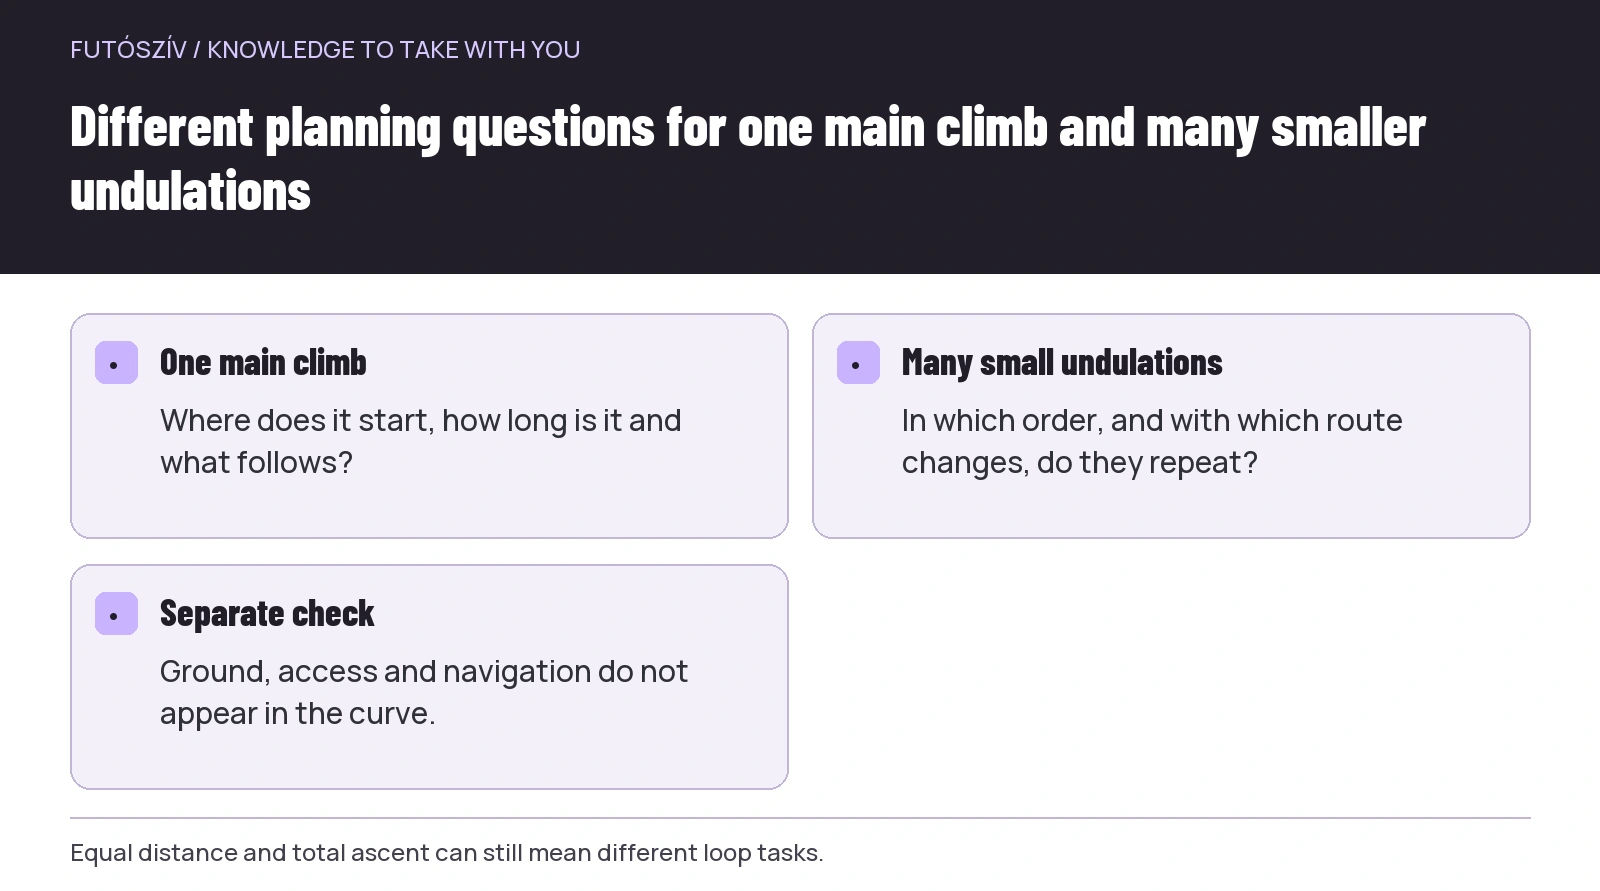 Enlarge diagram
Text version of the illustration
- One main climb
- Where does it start, how long is it and what follows?
- Many small undulations
- In which order, and with which route changes, do they repeat?
- Separate check
- Ground, access and navigation do not appear in the curve.
Descent is not a free finish
The final downward part can make it feel as though work certainly ends at the summit. The return remains a route and movement task. Examine its length, direction changes, surface and access to the endpoint. A descending line alone does not mean a fast or simple section.
One general technique rule is not the answer here either. Choose a route suited to your experience, and if still learning particular terrain, seek appropriate conditions and professional support where necessary. The important planning point is not omitting descent from time and route estimates.
Include urban or transport sections at the end too. Even when the profile returns to starting altitude, a walk to a stop, crossing or car-park search may remain. Connect the trail loop’s time frame with getting home.
An illustrative comparison of two twelve-kilometre loops
The first imaginary loop has one continuous climb after the start, then a long return. The second repeats six smaller undulations. Suppose distance and calculated ascent match. Describing both tasks with the same short sentence is still unhelpful.
For the first, planning questions concern climb length, surroundings at the higher point and checking the return. For the second, undulation sequence, repeated route changes and intermediate decisions may matter. Neither establishes one as easier for every runner. Experience and current purpose are needed.
Add a short description to each profile: a loop with one main climb versus one with many short undulations, for example. This is still no complete difficulty rating, but already provides more useful information than identical distance and ascent totals.
What information is absent from the curve?
Current ground conditions, mud, ice, fallen trees and temporary closures may not appear. Navigation complexity, changing shade and exposure, and links to transport may also be absent. These need separate information.
At the current MTSZ warnings you can check announcements concerning the area. Land-manager information and weather also belong to planning. A profile does not permit following a closed or uncertain section merely because its curve fits your expectations.
Do not estimate water access, services or exit options purely from elevation either. A seemingly nearby valley does not necessarily lead to an accessible stop. Check actual connections on the map and through appropriate sources.
Your profile-reading sheet in five lines
Record the route source and version. Second, give distance and the interpretation of elevation data. Third, name main climbs and descents in sequence. Fourth, identify sections needing further terrain or access information. Finally, explain why the loop fits your current programme.
A missing answer becomes another checking task. You need not declare the whole route unusable, but do not automatically label the unknown easy. A simpler, better-understood first outing is an option before returning to the more complex loop later.
After visiting, place your observation beside the profile rather than in its place. You can then compare what the drawing suggested with the actual demands. Next time, you will examine not just total ascent, but its distribution and associated route.
How Futószív articles are prepared: our editorial guidelines.