A large distance figure in the weekly summary can easily become the symbol of your whole running week. Yet the same distance can mean different things on a flat city loop, slower trails or several short outings with different tasks. Time spent running provides another view, but does not tell everything by itself either. Read the two values alongside each other, adding session count and the nature of the runs. This article concerns data interpretation: it does not establish universal weekly mileage, increase percentages or a training plan. It shows how your own log can provide a more useful summary.
Distance is the view of ground covered
Kilometres are a tangible external measure, easy to add together. They show how much ground the logged runs contain under the recording and editing method used. They can help summarise the same types of workouts or familiar routes. To interpret the figure, however, know which sports and recordings it includes. Running, walking and cycling kilometres can be added mathematically, but the result is not “weekly running distance”. The category name and filtering determine the story the graph tells.
Elevation and ground are not fully described by the distance figure. Two runs of equal distance can be different tasks without either having greater or lesser value. To review training, add a short description to kilometres: flat, hilly, technical or another category you use consistently. Avoid turning terminology into a complicated code system. Two or three well-understood types can help compare your weeks more than numerous small labels that later become inconsistent.
Time shows running’s place in your week
Time reveals how long you spent on the recorded activity. This is particularly tangible for daily scheduling. First name the time basis, however: does the summary contain activity time, moving time or total elapsed time? Systems handling stops differently produce different weekly figures. If planning actual time outside, a column summing only moving time may underrepresent the whole programme. Another definition may suit examining the recorded movement part of training. Clarify the time concept before comparison.
The official description of Strava’s summary chart presents views including time, distance, elevation and activity count by sport. This is a useful example of one database providing several summaries. Find the selected sport and period in your own log, and inspect the underlying activity list too. A column consists only of its included data. If an indoor session has no recorded distance, the time view may still show work barely visible on the distance graph.
The same kilometres, different time
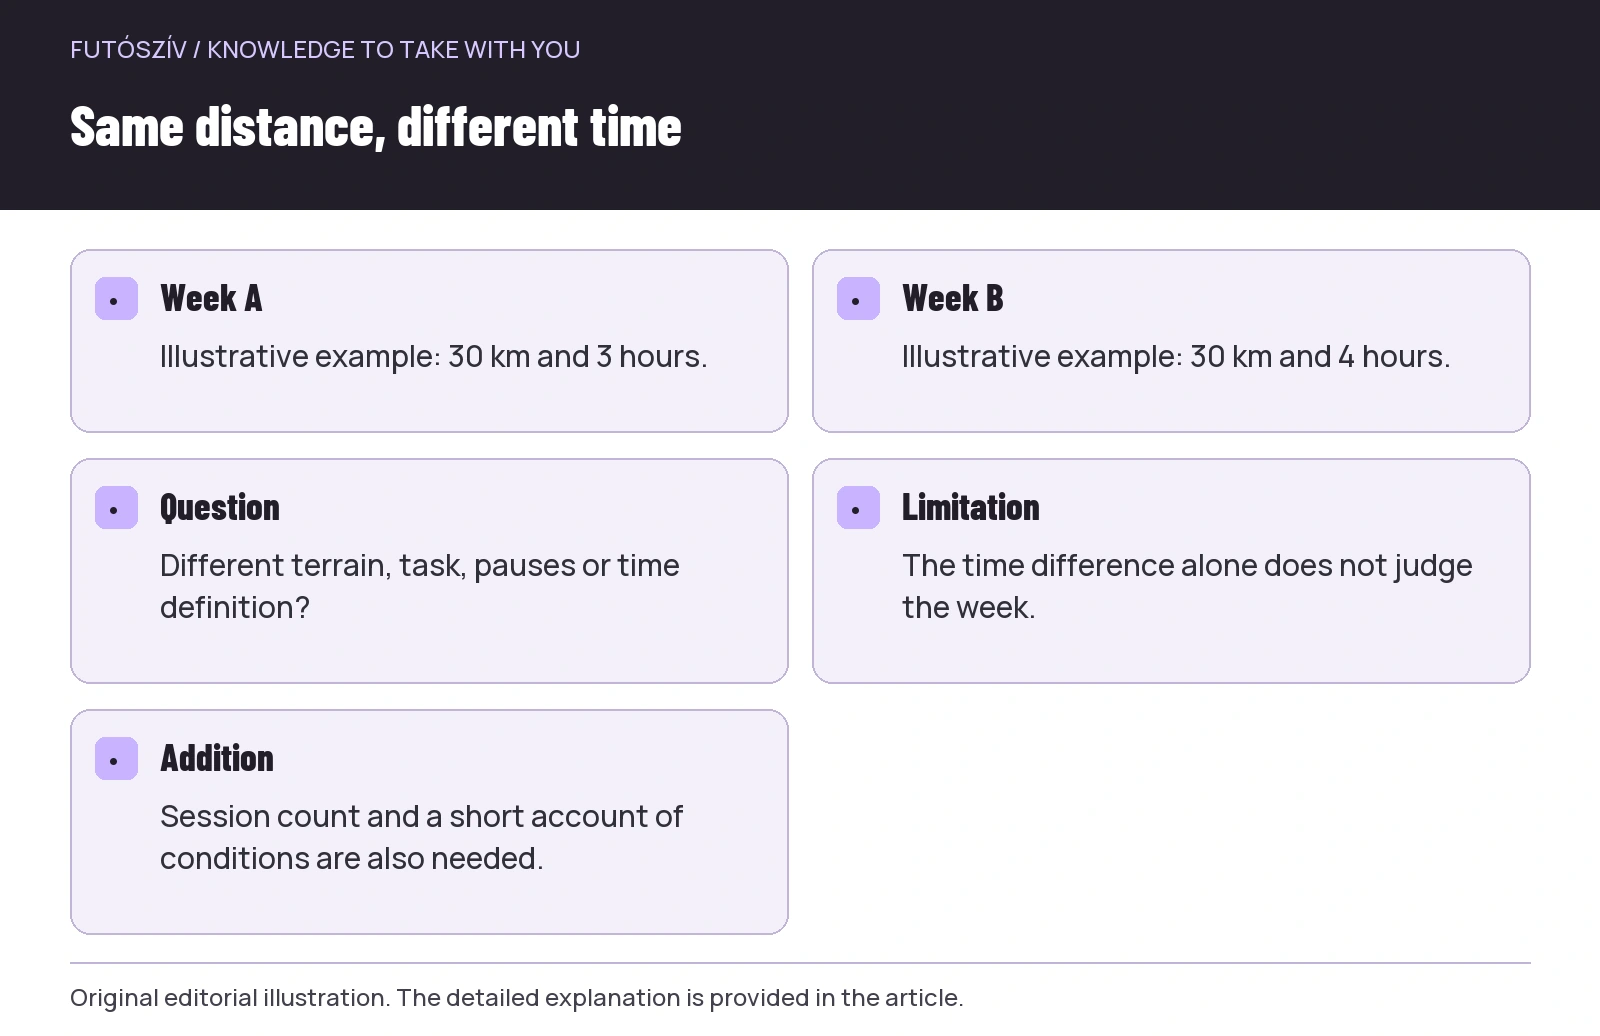
Take two illustrative weeks, not training plans. The first contains thirty running kilometres and three hours of recorded running time. The second also contains thirty kilometres, but four hours. The distance columns match while time differs. This does not automatically make the second week better, worse, harder or easier. Terrain, walking sections, purpose or time handling may have differed. The time view signals a further question that distance alone did not reveal.
The reverse also applies. Two weeks may each contain three hours of running while one shows fewer kilometres than the other. Together, the values can also summarise the average rate of progress, but different structures may underlie a weekly average. Do not automatically turn this into a performance ranking. Changing routes, pauses, weather and training tasks belong to interpretation too. The two views’ strength is revealing each other’s blind spots: they add time to distance and distance to time, while you still need to refine the questions.
 Enlarge diagram
Text version of the illustration
- Week A
- Illustrative example: 30 km and 3 hours.
- Week B
- Illustrative example: 30 km and 4 hours.
- Question
- Different terrain, task, pauses or time definition?
- Limitation
- The time difference alone does not judge the week.
- Addition
- Session count and a short account of conditions are also needed.
Keep weekly boundaries consistent
A Monday-to-Sunday calendar week and a rolling last-seven-days window cover different periods. In a Monday summary, the preceding weekend may carry different weight from a Thursday rolling view. Check the date range before comparing two numbers. Treating a month as four weeks can also produce an inaccurate summary: a calendar month differs from twenty-eight days. Complex statistics are unnecessary; matching time windows are enough. Check graph labels and selected filters regularly, particularly after changing platforms.
A long run at one week’s end and another early in the next may appear in separate calendar columns while being close in time. This is a summary limitation, not a calendar fault. When considering workload, also inspect session sequence and proximity in the list. A weekly number offers an overview, but Monday does not erase the previous day’s history. A rolling view may answer a different question, though it too should be used consistently. Let your own analytical purpose determine the window.
Session count is the third column
Thirty kilometres across three or six outings mean different scheduling and running structures. Add session count to weekly distance and time, but decide what counts as one session. Recording warm-up, main section and cool-down in three files may show three activities while you completed one training programme. Starting recording twice can also increase the count. Do not automatically equate raw activity count with training-session count. Keep clear which your own system uses.
A weekly overview row might contain running distance, running time under your chosen definition, running-session count and one sentence about the week’s character. This may suffice for an initial review. You need not assign every field a target or record. The short sentence might include a route change, travel or a missing recording if it explains the summary. Purposeful logging is detailed not because it collects many numbers, but because it places necessary circumstances beside the right number. This also gives future reviews a reference point.
| View | Shows well | Does not tell you by itself |
|---|---|---|
| Weekly kilometres | Recorded distance of selected runs | Duration, terrain and the full training character |
| Weekly running time | Volume under the selected time definition | Distance covered and intensity distribution |
| Session count | Frequency of runs or recordings | Length and purpose of sessions |
| Elevation data | Ascent summed under the system’s method | Ground and the whole route’s difficulty |
| Short note | The week’s known circumstances | Does not replace missing measurement data |
Volume and experienced strain are separate questions
Distance and time describe external volume, while the run’s experienced difficulty is different information. A case series involving twenty-four high-school cross-country runners compared weekly changes in different volume summaries and measures including perceived exertion. This small, young sample cannot support a general training rule for adult runners. It does provide a concrete research example of how selecting a measurement method can change the picture of change. In your own log, it is also worth adding simple, consistent feedback about the run’s character alongside numbers.
This does not mean inventing a homemade load formula every week without understanding its use. A new score combining several values is not automatically more reliable. If working with a coach, agree which data and comments they expect. For a personal overview, a specific observation often suffices: for example, “terrain meant longer time over the same distance” or “the week consisted of several short outings”. Perceived difficulty does not replace clarifying a health complaint, and a spreadsheet is not diagnostic. The purpose is following known circumstances.
General activity is more than running kilometres
If reviewing all movement across the week, running distance is only one element. Walking, cycling, strength work and other activity can be recorded differently. The WHO physical-activity guideline also discusses frequency, intensity and duration for different groups rather than prescribing one compulsory weekly running distance. Do not confuse a general health-related activity framework with preparation for a particular race. They answer different questions, and neither implies identical running volume for everyone.
Time for different sports can be reviewed in a shared calendar without making them exact substitutes. An hour of strength work need not be converted into kilometres to fit the running graph. Keeping sport type and duration distinct preserves information. If you want a separate view of running alongside all movement, use two views: total activity and running. The summaries have different roles. A day with another activity then does not look “empty”, while the meaning of running distance remains clear.
 Enlarge diagram
Text version of the illustration
- Sport
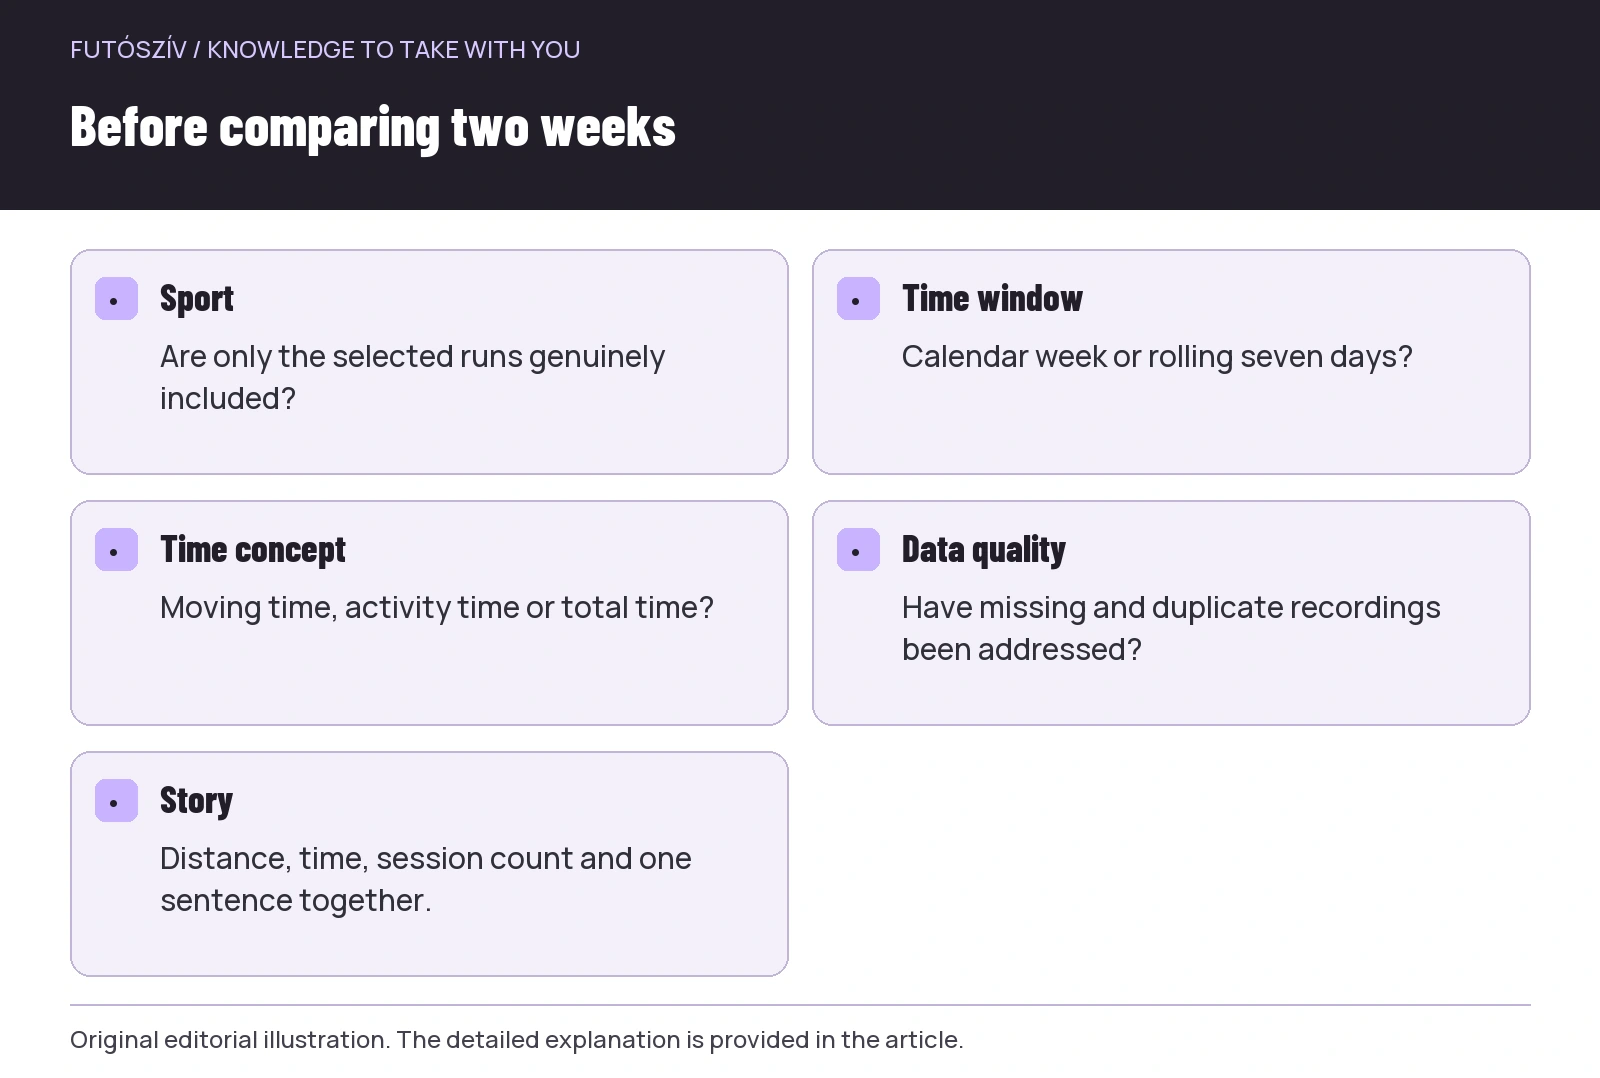
- Are only the selected runs genuinely included?
- Time window
- Calendar week or rolling seven days?
- Time concept
- Moving time, activity time or total time?
- Data quality
- Have missing and duplicate recordings been addressed?
- Story
- Distance, time, session count and one sentence together.
A missing recording should not become a silent zero
If you ran but the watch failed to record, the weekly graph contains less data. A zero or low column then does not necessarily mean less actual movement. Manual-entry options depend on the platform, and estimated volume should be labelled appropriately. If only time is certain, do not manufacture a supposedly precise distance. Describe the situation in the note. A known data gap remains interpretable later, whereas an unlabelled assumed number can acquire the same status as a recorded activity.
Imported and duplicate runs can distort in the opposite direction: the weekly figure looks larger than reality. For an unusual change, open the underlying list first. Check for two entries with the same start time, an incorrect sport type or travel accidentally left recording. Clean data precedes complex interpretation. If weekly volume suddenly jumps, do not immediately analyse it as a training change; first verify you are comparing the same activity scope and data quality. The table depends on its inputs.
Percentage change: the baseline matters
Going from ten to fifteen kilometres is a five-kilometre difference and a fifty-per-cent change. Forty to forty-five is also five kilometres, but twelve and a half per cent. These are mathematical examples, not training suggestions. Calculate percentages relative to the preceding value selected as the baseline. After a break or incomplete recording, a small base may produce a large ratio without describing the whole situation. Do not judge a week by one percentage. Whether a volume increase is suitable is an individual training question requiring background and further factors.
Percentage changes in distance and time can differ too. More hilly routes may change running time differently from kilometres. If you switched time definitions, the comparison basis changed. Describe the data change and circumstances first, then interpret. A well-structured weekly row does not demand an automatic reaction to every movement. Instead, it helps ask what changed in the runs, data collection or life circumstances. A specific answer is worth more than an isolated displayed arrow.
Five minutes a week for interpretation
At the week’s end, inspect the list, then extract distance, time and session count using matching filters. Add a short sentence about circumstances and flag known data gaps. For comparisons, use the same date logic and time definition. This routine does not require detailed analysis of every run. It preserves the real story behind summary figures. If discussing your work with a professional later, a clear log and brief contextual description can provide a useful starting point.
Distance and time complement each other. One shows ground covered, the other time invested under a chosen definition, while session count helps explain structure. Intensity, terrain and your own feedback provide further layers. Every column need not increase every week for the log to have value. The best weekly view lets you explain clearly what you did, under which conditions and with what data quality. This transparent foundation can support the next question relevant to your own goal.
Sources and further reading
- Strava – Progress Summary Chart
- Quantification Method and Training Load Changes in High School Cross-Country Runners
- WHO – Guidelines on Physical Activity and Sedentary Behaviour
How Futószív articles are prepared: our editorial guidelines.