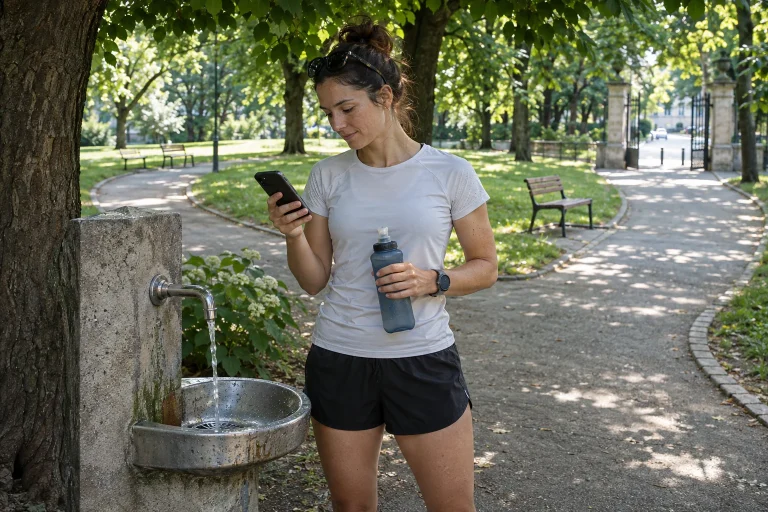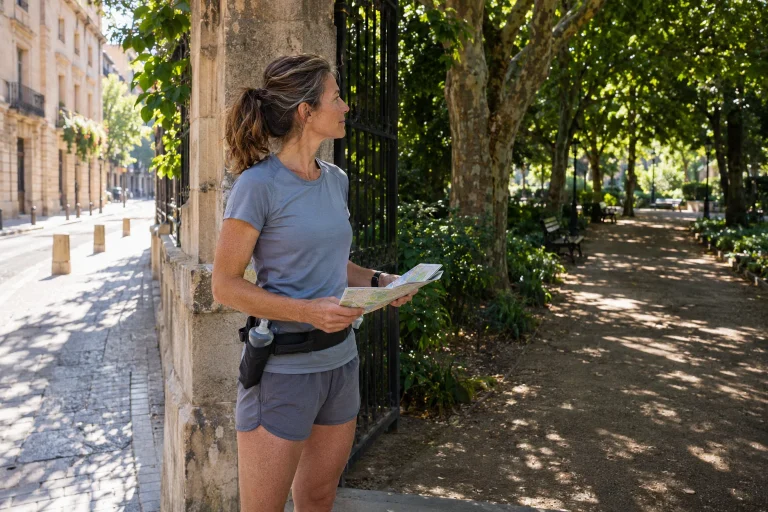
Air temperature, heat index and WBGT can give three different numbers on the same summer day. A runner’s task is not to find the friendliest one. The measures use different inputs and assumptions, so first understand which question each answers. Traditional heat index is designed for shade and light wind; WBGT also accounts for the effects of radiant conditions and air movement.
This article helps you read indices; it is not a personal summer training programme. It includes an original calculation with fictional sensor data, an on-site measurement checklist and an example event message. The numerical examples do not authorise running in those conditions. Symptoms, health status, official warnings and the organiser’s decision cannot be replaced by a favourable colour beside one index.
Heat index combines air temperature and relative humidity
National Weather Service information on heat-forecast tools presents heat index as a combined interpretation of air temperature and relative humidity. Its assumed setting is shaded with light wind. In full sunshine, therefore, do not read the display as a complete account of the heat load on someone running on exposed asphalt. Traditional heat index does not treat sunshine as a separate input field.
An everyday misunderstanding is easy to recognise: we mentally attach our intended route to a city forecast. Yet a shaded park branch and a sunny, wind-sheltered course section do not become identical environments because they belong to the same town. Track sunny sections separately in the route description too. This is an organisational step, not a home-made revision of heat index afterwards.
If the app says only ‘feels like’, do not infer the formula from the number. It may use another provider-specific measure. Find the field name and methods description, especially when another page shows WBGT. Different indices are not automatically evidence of forecast error. They may have been designed to summarise different phenomena and conditions in the first place.
What does WBGT add, and what does the black globe measure?
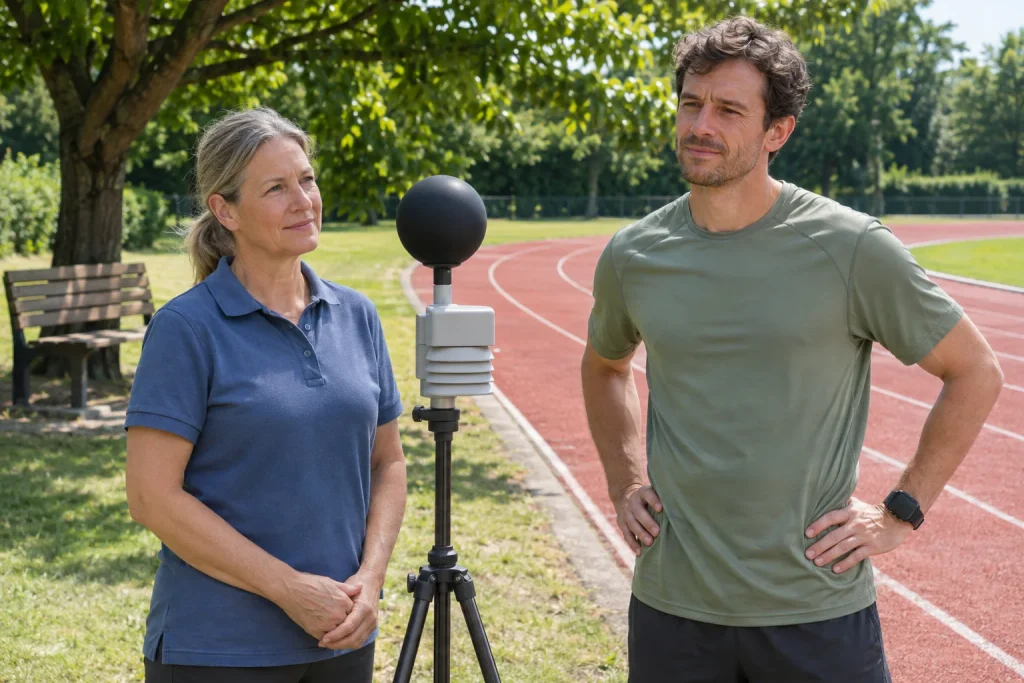
OSHA’s on-site heat-stress information distinguishes three measurement elements: a dry-bulb thermometer characterises air temperature, a natural wet-bulb thermometer the potential for evaporative cooling and a black-globe thermometer the effect of radiant conditions. WBGT therefore takes a more combined approach to air, moisture, radiation and airflow. Globe temperature is not a direct measurement of either the runner’s skin or the asphalt surface.
The occupational-safety page also emphasises locating the instrument in the actual activity environment and following manufacturer placement and use instructions. The transferable point for runners is that ‘on-site measurement’ includes describing the site. Data from an instrument in an office window or deep inside a service tent cannot be called a sunny-course measurement merely because it is nearby.
A black globe alone does not establish a particular device’s measurement quality. A commercial unit may be a calculating or combined instrument; documentation must explain the sensors, procedure and operating details. When buying, therefore, seek more than WBGT on the box. Understand what it actually senses, what it calculates and which conditions its use requires. We tested no product and created no brand ranking in this article.
 Enlarge image
An original example: the index is not a simple average of three temperatures
The NWS Wichita explanation gives the following relationship for conditions with solar radiation: WBGT = 0.7 × Tw + 0.2 × Tg + 0.1 × Td. Here Tw is the natural wet-bulb reading, Tg the globe reading and Td the dry-bulb reading. Read the expression alongside its stated conditions; the same weighting is not chosen for every measurement situation. Wet-bulb temperature is not the same as the dew-point field.
Our teaching example uses three fictional inputs of 25, 45 and 33 °C respectively. The calculation is 0.7 × 25 + 0.2 × 45 + 0.1 × 33 = 17.5 + 9 + 3.3 = 29.8 °C WBGT. Their simple average would instead be approximately 34.3 °C. That second result is not the same measure. The example shows how a weighted relationship works, not a measurement of an actual running course.
Now change only the fictional globe reading from 45 to 35 °C, keeping the other two values fixed. The new result is 27.8 °C WBGT, two degrees lower. This follows from a mathematical change, not a promise that park shade changes on-site data by exactly that amount. Several inputs may change in an actual environmental transition; assumptions fixed for the table are not field measurements.
Measured, estimated or forecast: look for this beside WBGT too
A web WBGT forecast estimates later conditions. An appropriately conducted on-site observation describes a specific place and time. A calculator uses entered inputs; filling fields does not itself turn a phone into an on-site measuring instrument. All three can help when their roles are identified. The dangerous shortcut is losing that distinction from a forwarded screenshot.
| Data type | What should accompany it? | What should not be inferred automatically? |
|---|---|---|
| Forecast WBGT | Valid time, place and provider. | This is not a value already measured in the start area. |
| On-site WBGT | Measurement time, placement and instrument method. | It does not necessarily describe every point along the route. |
| A calculated example | Entered variables and the formula used. | It does not validate the inputs. |
| A colour category | The particular scale’s name and intended audience. | It does not become a Hungarian race rule by itself. |
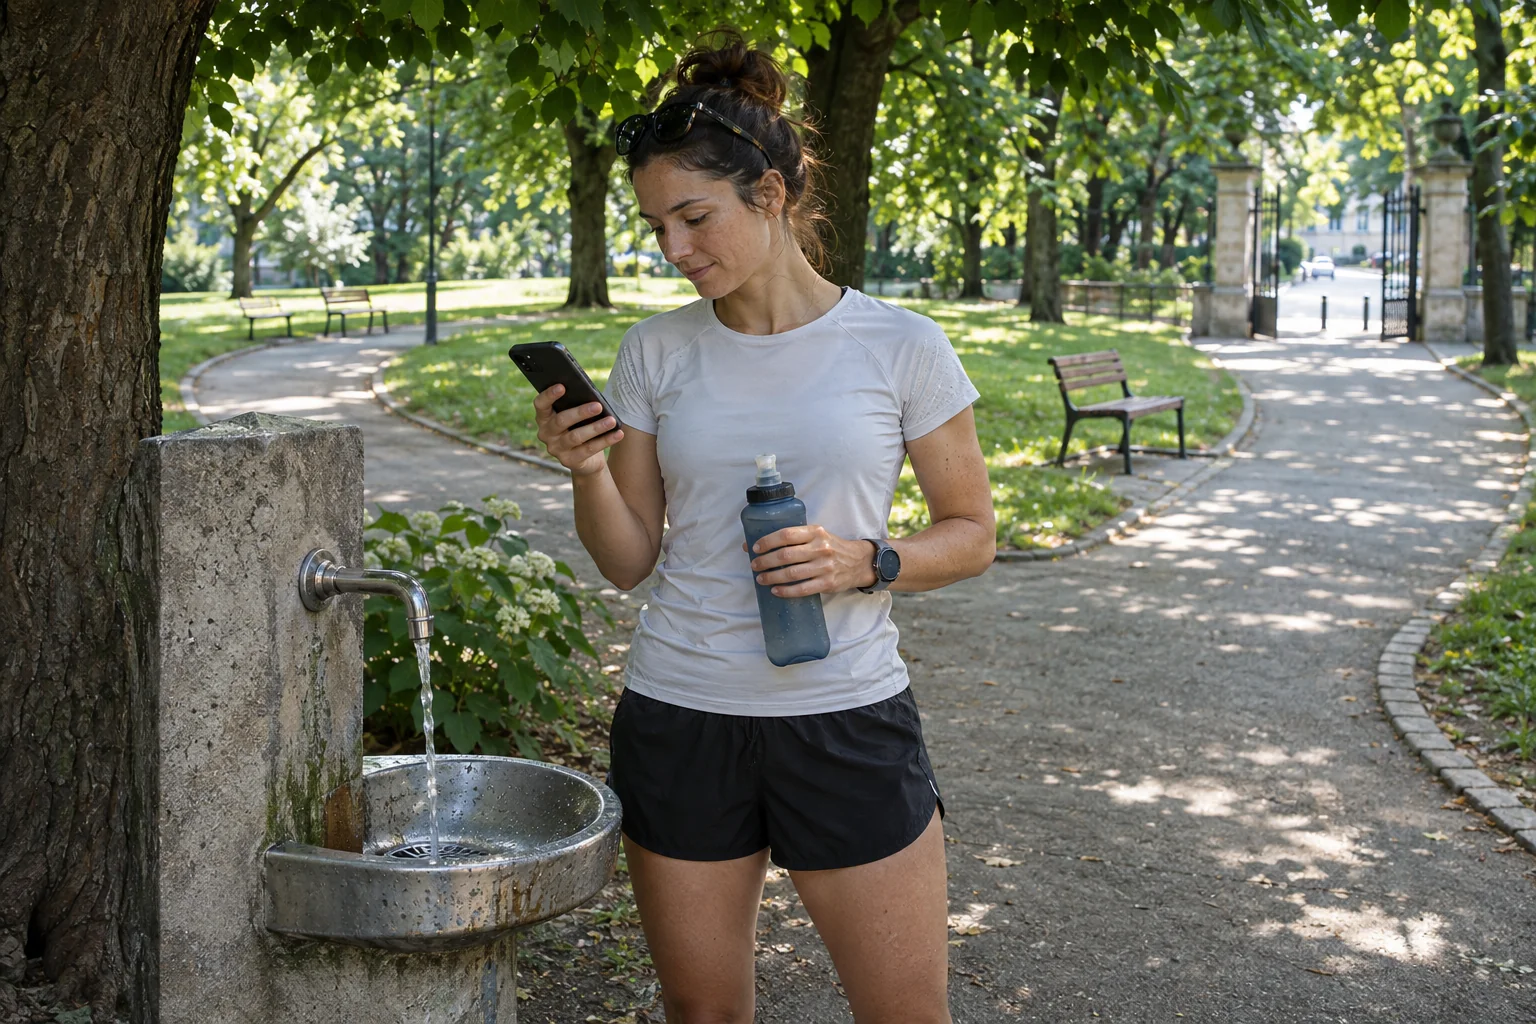
In our data-sharing example, one line starts: ‘forecast for Saturday at 10:00, from the named provider’. Another type reads: ‘on-site data, Saturday at 09:40, at the designated course point’. We deliberately assign no invented actual value to the examples. The first words should make the information’s temporal and spatial role clear before anyone compares numbers.
What do race data show about multiple variables?
A study published in a 2022 journal issue analysed 1,258 races, considering air temperature, humidity, wind and solar radiation together. Race data covered several endurance disciplines, with weather data from nearby stations. WBGT alone explained performance better than air temperature alone, but did not explain everything. This observational analysis is not equivalent to predicting every future result of a particular runner.
Ely and colleagues’ 2007 marathon study compared different years of several major races and different finishing groups. Warmer WBGT ranges generally accompanied slower performance, but patterns were not identical across groups. For the best women’s group, for example, differences between the reported ranges were not statistically significant. We therefore do not turn the result into a table adding identical seconds per degree for everyone.
Both studies help explain why relying on plain air temperature alone is unhelpful here. Personal decisions still require individual history, that day’s condition and the specific outing. If an online calculator promises a certain marathon target time from one index, ask which data validate that individual forecast. A group average is not the same claim as your next finishing time.
Colour categories do not automatically transfer to another event
The NWS Wichita page separately presents general thresholds and categories belonging to a particular American school-sports organisation. This alone shows why interpreting colours requires the scale’s name and intended use. A screenshot’s red field does not itself identify which rule a Hungarian organiser uses to postpone, shorten or stop a race.
After entering, find the race’s own information: who announces weather-related changes, where the official message appears and what to do when the route changes. Answers are not always numerical thresholds. They may be specific instructions about start time or distance. Do not use an outside app’s colour to overrule the organiser or wait for every provider to display the same colour name.
Our example running-club message could read: ‘We are changing the afternoon session time; the final meeting arrangements will be posted through this channel; please do not travel to the original location without reading the update.’ This is not an announcement for an existing event. It illustrates that communicating a decision need not leave participants to interpret several different heat scales.
 Enlarge image
The runner’s own circumstances belong alongside the index
CDC heat information explains that heat can affect anyone, but pregnancy, older age and certain chronic conditions may require additional attention. Medicines can also alter heat-related risk; do not stop or change medication yourself. Discuss an individual plan with your treating clinician in such circumstances. A lower index is not general medical clearance for exertion.
NIOSH lists confusion, altered mental state, seizures and loss of consciousness as signs of serious heat illness. With heatstroke, skin may be dry, but heavy sweating can also occur; you need not wait for sweating to stop before seeking help. In Hungary, call 112 with such severe symptoms, stop exertion, begin cooling and follow the emergency dispatcher’s instructions. Do not leave the symptomatic person alone.
In ordinary route planning, make your question specific. Can you stop the outing, where will a companion wait and how can you change the plan in time? Answer these separately without inventing a health-risk score at home. The index primarily contributes to interpreting environmental conditions; activity and the person must not disappear from the full decision.
A short data check is worth more than selecting the favourable number
Before sending heat data to fellow runners, read five fields: measure name, unit, place, time and data type. Celsius within WBGT does not mean the number equals air temperature measured in Celsius. Equally, subtracting different indices does not provide a personal difference in heat load. Begin every comparison by clarifying meaning.
Retain what is actually known in your training log and mark missing information as missing. If you had only a city forecast, say so; do not later call it course-measured WBGT. If an organiser supplied data, retain its time and the associated action. Later review can then preserve what was genuinely knowable at that moment rather than make the memory more precise than reality.
Understanding heat index and WBGT ultimately supports a more useful decision: you recognise when sunny, windy or wind-sheltered conditions need more information. You do not demand what neither index claims to offer: personal diagnosis, a certain target time or automatic permission to start. Good data reading and clear outing plans together help you address running conditions in time and understandably.
Sources and teaching examples
Checked: 21 November 2026. The example with inputs of 25–45–33 °C and its modification are original calculations; data-sharing and club messages are original templates. They involve no original course measurements or documented medical review.
- NWS: Heat Forecast Tools – the basic meanings of heat index and WBGT
- NWS Wichita: Wet Bulb Globe Temperature vs Heat Index – formula and categories
- OSHA: Heat Hazard Recognition – on-site measurement and sensors
- Effects of Weather Parameters on Endurance Running Performance: Discipline-specific Analysis of 1258 Races, 2022
- Ely and colleagues: Impact of weather on marathon-running performance, 2007
- CDC: About Heat and Your Health – individual risk factors
- NIOSH: Heat-related Illnesses – severe symptoms and urgent help
How Futószív articles are prepared: our editorial guidelines.