Two matching graphs can come from one sensor
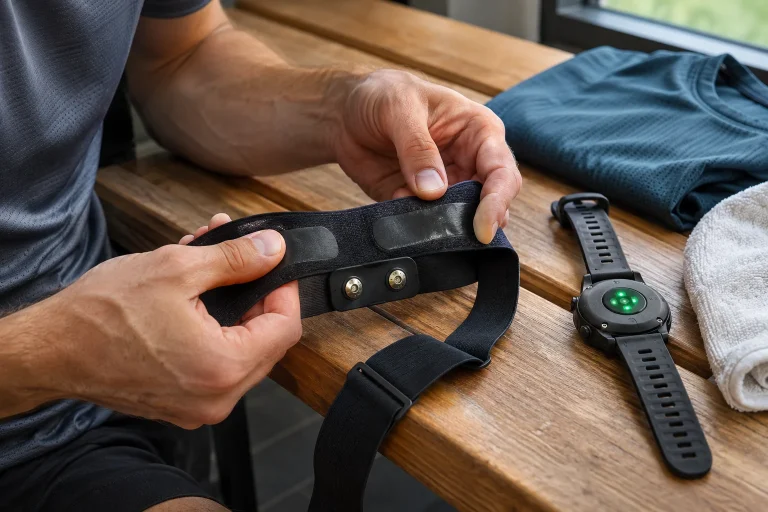
Two sports watches on your arms show the same pulse, and their evening graphs nearly overlap. It is easy to conclude they independently confirmed accuracy. First understand the data path. If both recorded the same chest strap, you compared two receivers rather than two sensors. The result is useful but answers another question.
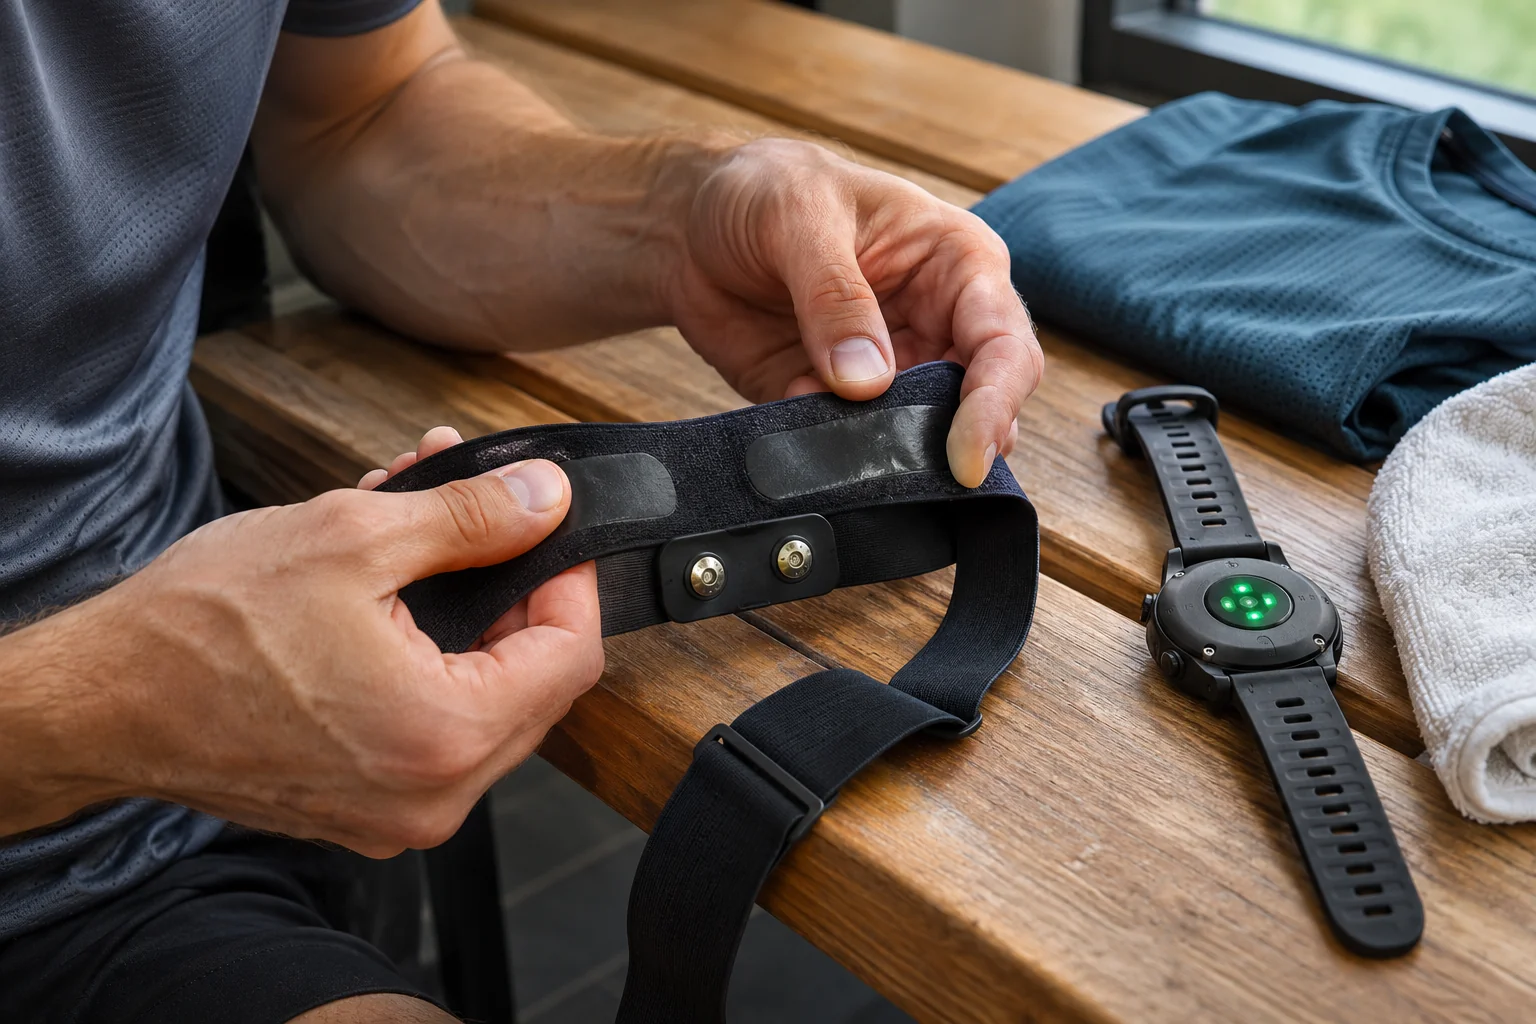
Polar H10, for example, supports two simultaneous Bluetooth connections and separate ANT+ transmission according to its manual. One strap can therefore appear on several compatible receivers. A different connection path does not create another physiological measurement; the source remains shared. Source: current H10 sensor settings. Match each setup to your own devices’ documented support.
This does not make a two-watch trial pointless. It may reveal whether both save incoming data similarly, lose sections or produce different summaries. Just do not call it independent sensor validation. Say: “Two receivers recorded one strap, producing similar series over the shared period.” That claims what the trial actually examined.
Draw the measurement’s family tree
A simple diagram may explain more than two coloured curves. Put the measured phenomenon at the top, then sensor, transmission, recorder and analysis programme. Branching after the sensor means two files from one measurement. Separate sensor branches begin two measurement paths. Shared errors may remain, but the point where independence starts becomes clear.
Imagine three setups. One strap sends to two watches. Another uses one watch’s wrist sensor and a separate strap. A research setup uses a separate ECG alongside strap data. Each suits different questions. Screens do not determine the number of measurement paths; sensing and how data are generated do.
Name processing too. Importing both files into one analyser may transform them similarly. Screenshots from separate platforms may involve different smoothing or summaries. “Two watches” therefore cannot describe the full experiment. Sensor, recorder and analyser all belong in what was actually compared.
A device name also needs an identifier
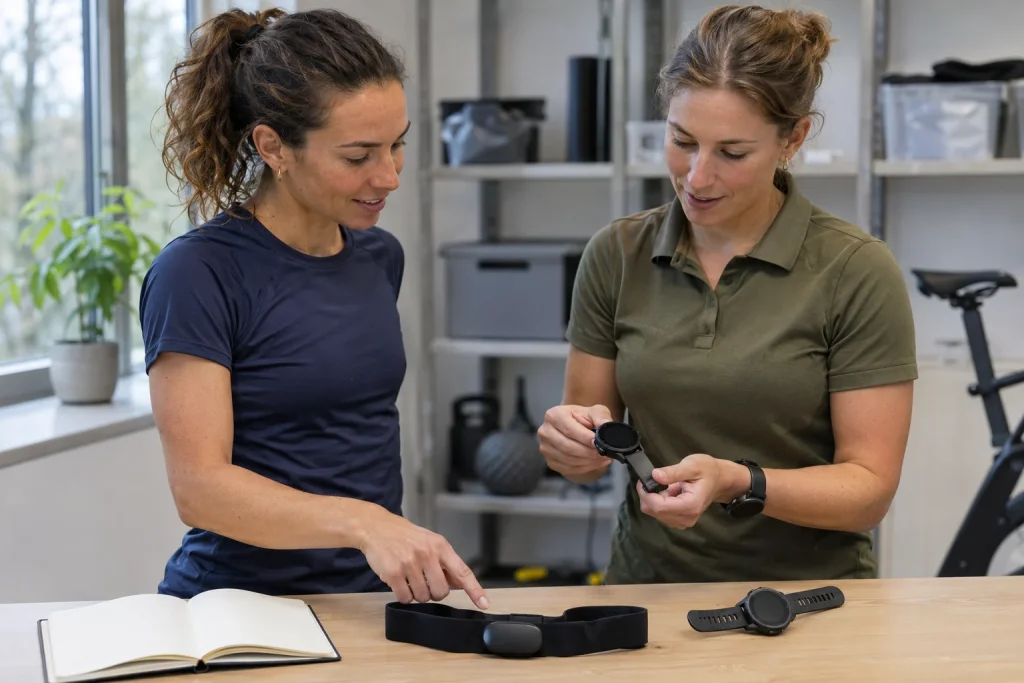
Two identical sensor models are easily confused in group training or a laboratory. Compare the added sensor identifier with your own device according to manufacturer instructions. Matching brand and model do not establish connection to the particular strap worn. Clarify that before starting rather than guess later.
Use short personal codes such as S1 for strap one, W1 and W2 for watches. Keep the mapping to full identifiers separately and privately; graphs can use short codes. This does not anonymise the whole workout, but avoids unnecessarily publishing identifiers in a comparison. Traceability and data minimisation can coexist.
Before every trial, record the active sensor on each watch. To compare wrist sensing with a strap, ensure the relevant watch is not silently receiving that same external signal. Check device indicators and settings; wearing it on the arm does not establish wrist origin. Unexpectedly perfect agreement is often a reason to recheck the signal path.
 Enlarge image
What can the original FIT file add?
Garmin’s decoding guide says Activity files’ Device Info messages may store details of accessories and sensors used during exercise. Possible fields include manufacturer, description, serial number, software version and battery state. “May” matters: not every file contains every field. Metadata offer provenance clues rather than complete guarantees. Source: Garmin FIT, decoding Activity files.
Preserve the original beside converted platform exports. Later format changes may remove metadata present originally. Look separately for recording watch and external accessory: several entries do not mean every device supplied the same metric. Interpret the list with the pre-test connection note rather than as its replacement.
Do not overinterpret missing metadata either. An absent strap serial number does not prove it was unused. A recorder may not write it or an exporter may omit it. Then origin stays uncertain and should be reported. “Not documented” is more valuable than a convenient unsupported source assignment.
The same error in two copies is still the same error
Take our invented series. Reference values at selected moments are 140, 150 and 160 beats per minute. An imaginary sensor sends ten more each time: 150, 160 and 170. Two watches saving this identically differ by zero while both differ from the reference by ten. This is mathematics, not a device’s actual fault, illustrating the inference problem from a shared source.
Agreement between receivers is not directly agreement with reality; an independently interpretable reference is missing. Strong association can persist under a constant offset: all three points rise alike at different values. Similar curve shape and actual numerical difference are separate questions. Describe both before grading a device.
Report observations before interpretation. “The two recorded series coincided in the shared section” is specific. “Both watches have medical accuracy” does not follow. A home trial cannot certify clinical suitability, and another display repeating a sports measurement does not turn it into a diagnosis. This article supports technical comparison rather than health assessment.
Different curves can also come from one sensor
Recording and display can differ after shared sensing. One programme may show denser points, another sparse summaries; investigate processing separately. In our example, incoming values are 140, 160 and 140. A three-point average gives 146.7 for the middle window. This is no actual watch algorithm, only an illustration of how processing alters appearance.
A time shift can mislead similarly. With two seconds’ offset, one graph may lead at a rapid change despite shared origin. First align timestamps and identify the common recording period. If you shift a series for comparison, state amount and reason. Undisclosed adjustment for better visual overlap misrepresents original behaviour.
Keep missing-data handling visible too. One programme connects available points, another shows a break. A continuous line need not prove continuous recording. Mark where actual samples exist and do not. Never silently replace a missing period with a convenient mean. Data loss is an independent result when examining recording systems, easily hidden by smooth graphs.
What does an independent reference mean in actual research?
Johansson and colleagues’ study published in 2026 compared separate ECG, Polar H10 and phone-camera app data in 37 trained participants. Two short recordings on the same day were analysed under controlled conditions. It is a useful methods example because it names paths and reference roles, rather than comparing two watch screens connected to the same strap. Source: Johansson and colleagues, original HRV study.
Even such research supports conclusions only within its design. Short resting HRV differs from tracking wrist pulse during fast running. Data, movement and processing may differ. Do not extend a favourable finding to every sport mode, age or app. Study methods show what was checked; your use question shows what remains.
An independent path alone does not guarantee a perfect reference. Its operation, timing and quality matter too. Serious physiological measurement requires appropriate design and professional interpretation. For a home running trial, avoiding claims beyond what was done is already progress. A connection check can be good and useful without being called full validation research.
 Enlarge image
Make a test sheet another runner could understand
Put the trial question in the heading: “Do both my watches record the same strap without interruption?” This is narrower and more answerable than “Which watch is more accurate?” List sensor, receivers, routes, software and expected data. The same sheet can reconstruct tomorrow’s trial without relying on memory.
Give observed events their own space: late start, pause, displayed disconnection, device swap or deliberate setting change. Separate observation from explanation. “The value disappeared at minute five” is observed; “the strap failed” may need more evidence. Merging these pre-decides the faulty device before analysis.
Leave room for unknowns. An undocumented source, absent metadata, different starts or values reconstructed only from screenshots all narrow conclusions. Reporting them does not weaken useful observations; it shows what to record better next time. A good comparison may yield no ranking but almost always a more precise question.
Name what was genuinely separate in the conclusion
The first report sentence should state independent sensor and recorder counts. With one sensor and two watches, discuss recording or transmission behaviour. With separate sensors but no reference, say that too. Readers then know expected claim strength before seeing the graph. A transparent path matters more than an exaggerated grade attached to striking agreement.
Derive the next step from the original question. If one receiver lost sections, investigate connection and recording conditions. If wrist comparison was intended but both watches used the strap, design another trial with genuinely separate sources. If the aim was checking two recorders of one strap, the trial may already answer that narrow question.
Sports data depend largely on knowing their origin. Two displays may be windows onto one measurement, while two measurements are not necessarily a qualified reference comparison. Identifiers, a connection diagram and original files place results correctly. Agreement then avoids excessive confidence, and discrepancy becomes a traceable technical observation rather than a premature verdict.
Sources
- Polar H10: sensor settings
- Garmin FIT: decoding Activity files
- Johansson and colleagues: comparison of HRV devices
How Futószív articles are prepared: our editorial guidelines.