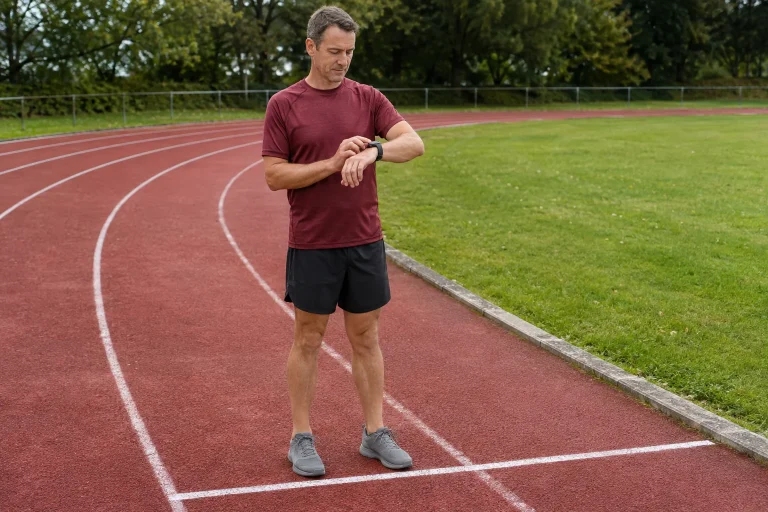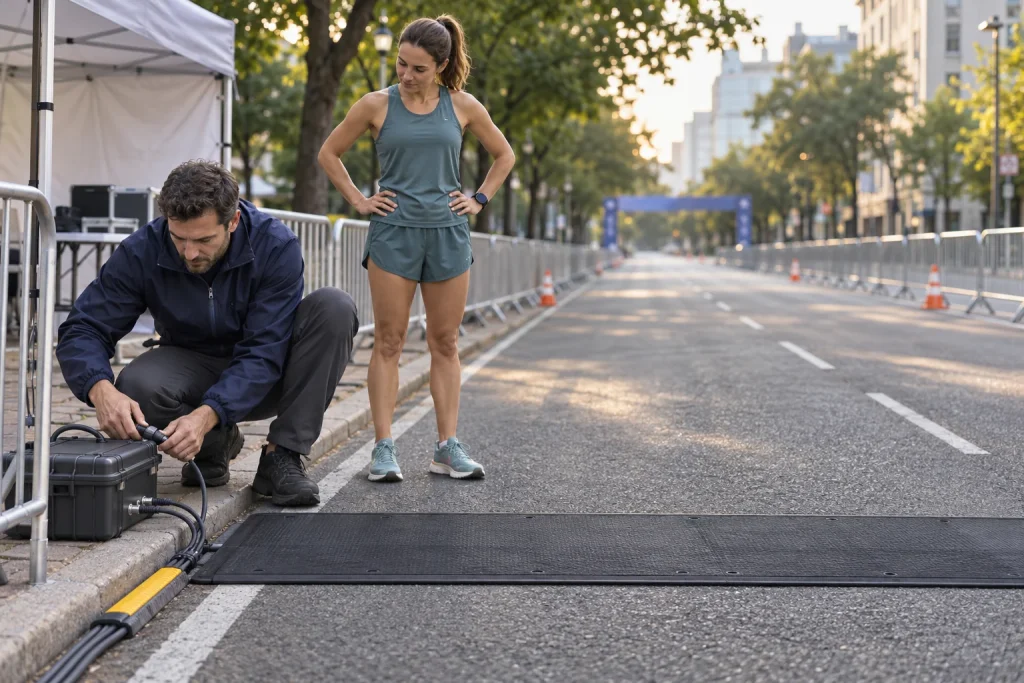
Two five-kilometre splits in the results list are nearly identical. This may suggest an orderly race, but the same average can conceal stops, acceleration and fluctuating pace. Marathon splits become genuinely useful when you know where timing begins, the distance each row covers and how much detail one number compresses.
The results show checkpoints, not a continuous film
An official split rests on a recorded passage at a specified course point. Between two passages, elapsed time is known, but not its distribution along the route. The section may have been steady, variable or briefly interrupted. The average creates the same quotient from all: elapsed time divided by section distance.
The 2026 research analysing Boston Marathon splits identified pacing patterns in 78,912 finishers’ data from 2015–2017. It used half-marathon passage alongside five-kilometre points. Such a database shows differences between race patterns at scale, but cannot see moment-by-moment progress at the same resolution.
Identify your own question: overall pacing, or events near a particular aid station? Official sections can reveal much about the first. Memory, watch recording and precise location together may better address the second. The question’s detail determines the data detail needed.
First distinguish cumulative time from section time
Cumulative time is elapsed time from a named starting point to passage. Section time is the difference between consecutive passages. If the 5 km row shows 25:00 and the 10 km row 50:30, the second five kilometres took 25:30. Do not divide 50:30 by five: that already totals the first ten kilometres.
Seconds offer a dependable subtraction method. 50:30 is 3,030 seconds and 25:00 is 1,500; the difference is 1,530. Dividing by five kilometres gives 306 seconds/km, or 5:06 min/km. Simple as it is, this often goes wrong in hurried spreadsheets, especially if hours:minutes:seconds is treated as a decimal.
Keep original column names too. Split may mean section time on one interface and passage point on another. If unclear, consult organiser or timing-provider explanations first. Name your own columns clearly: course point, cumulative time, section distance, section time and calculated average pace. Others can then follow the calculation.
A fictional marathon table walks through the arithmetic
The following data are an invented educational example, not a real runner’s result. Cumulative times share one starting point. The half-marathon point has its own row, so neighbouring section distances differ from five kilometres. The table’s structure shows why every pair of rows cannot use the same divisor.
| Course point | Cumulative time | Time since previous point |
|---|---|---|
| 5 km | 25:00 | 25:00 |
| 10 km | 50:30 | 25:30 |
| 15 km | 1:16:00 | 25:30 |
| 20 km | 1:42:00 | 26:00 |
| 21.0975 km | 1:47:45 | 5:45 |
| 25 km | 2:08:30 | 20:45 |
| 30 km | 2:36:30 | 28:00 |
| 35 km | 3:05:30 | 29:00 |
| 40 km | 3:35:00 | 29:30 |
| 42.195 km | 3:47:30 | 12:30 |
The 10–15 km section is 25:30, or 5:06 min/km; 15–20 km is 26:00, or 5:12. The 25–30 km section is 28:00, or 5:36. Equal distances make section times more directly comparable. A larger later number clearly means longer time for the same distance, but the table does not name its cause.
Near the half-marathon row, things differ. The 5:45 between 20 and 21.0975 km covers 1.0975 kilometres. The 20:45 from halfway to 25 km covers 3.9025 kilometres. Treating the latter as five gives falsely fast pace. Alternatively subtract the 20 and 25 km cumulative times directly for the full five: 26:30, or 5:18 min/km.
 Enlarge image
The short finishing section is not five kilometres
After kilometre 40, a marathon has 2.195 kilometres left. The example takes 12:30: 750 seconds divided by 2.195, about 342 seconds/km or 5:42 min/km. Comparing raw 12:30 with the preceding five kilometres’ 29:30 and declaring enormous acceleration makes no sense. First standardise units and distance basis.
The shorter finish may also combine different events: changing rhythm as the finish approaches, turns or congestion. Its average can be correct while requiring cautious interpretation. Improvement over a short last section does not establish what another five kilometres would have looked like. Finishing is a distinct situation.
When graphing, use actual distance on the horizontal axis. The 40–42.195 section is shorter than a five-kilometre window; equal-width bars can hide that. Presentation influences interpretation alongside correct pace arithmetic. An accurate table often helps more than a striking but misleading curve.
Much can happen between two mats despite the same average
Two runners cover five kilometres in 27:30. One runs steadily at 5:30; the other stops, runs faster and returns to a comfortable pace. Official section averages match while demands and decisions differ. This is a general resolution limit: one aggregate time cannot reconstruct internal order.
The large-database research on late marathon pace decline also examined patterns recognisable from splits. It enables consistent comparison of many runs without replacing every runner’s event history. Add brief notes about unusual stops or tactical changes for your own race.
A practical method adds only key events beside the table: aid-station stop, long climb, strong headwind, congested turn or deliberate slowing with a companion. Every second needs no explanation. Keep retrievable context for larger differences and do not confuse calculation with knowing the whole story.
Chip time, start signal and watch: align the starting point
At mass starts, time may pass between the gun and crossing the line. Organisers may display different times, and placing rules depend on the event. The 2026 Boston rules specify chip time’s role, for example. Do not generalise this automatically to every race; that event’s information governs.
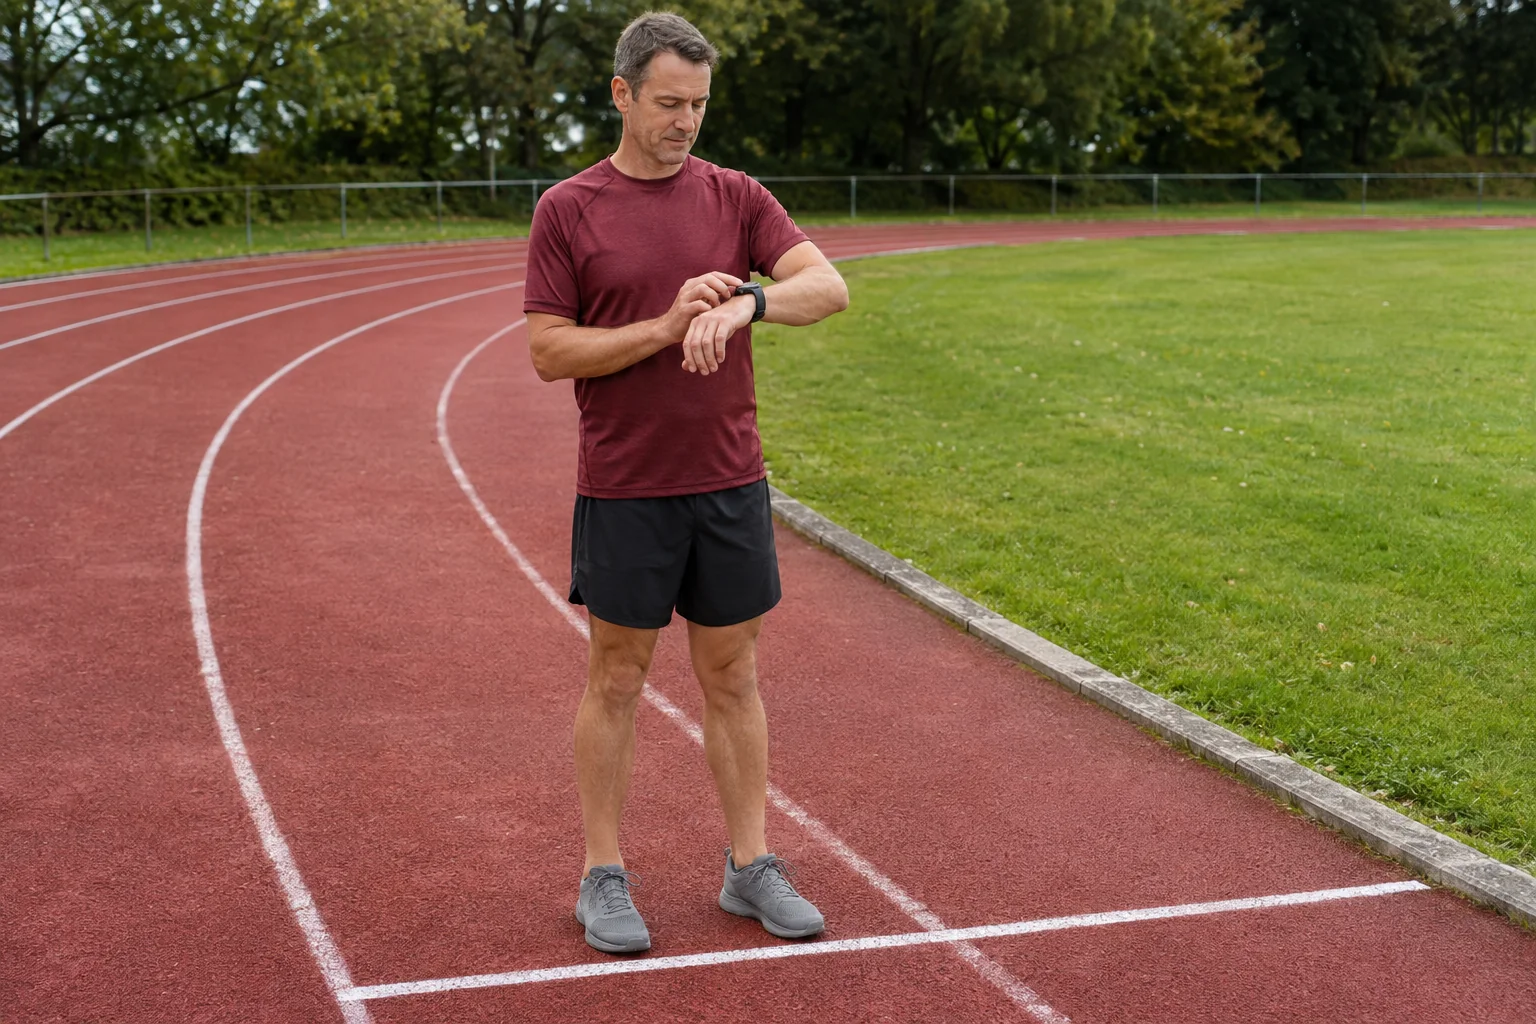
If your watch started at the line but you copy gun-based results, a constant discrepancy may appear in early rows. Neither measurement is necessarily wrong. Clarify the starting point first. The same constant difference may cancel between sections while remaining important for total finish time and the first section.
The finish differs too. You may stop the watch later, or auto-pause may omit standing. Official passage and watch activity serve different purposes. They need not be edited into agreement. Identify clearly which timeline you mean and why it may differ.
A second-by-second watch file is more detailed, not all-knowing
The Garmin FIT documentation explains that activity files may contain timestamped samples, events and different summaries. This allows recording progression rather than checkpoints alone. Recording frequency and actual fields depend on the recording and device. Greater detail does not mean every second’s data are perfect.
A GPS-estimated route and officially designated point are not the same measurement object. Position jumps beside tall buildings may distort instantaneous pace, and actual running lines may differ from the theoretical shortest line. Watch kilometre alerts therefore may not coincide with official five-kilometre markers. This does not automatically establish a wrongly measured course.
Keep official splits and watch detail in separate views. The former anchors elapsed time between points; the latter may identify events within sections. With discrepancies, do not choose the favourable number as proof. Check whether timing, distance and pause treatment match.
 Enlarge image
Do not manufacture a proven story from a missing split
An empty cell means no time is displayed on that interface. Clarify the cause separately: technical issue, display omission or discrepancy for organisers to investigate. An analysing companion should not conclude a performance was irregular from one gap. Organisers hold the timing-system and race-rule context.
Mark missing data as missing. With 25 km absent but 20 and 30 km present, calculate the whole ten-kilometre time, not the two separate five-kilometre times. Even distribution may provide an illustrative estimate, but must not be presented as measured splits. Estimated and observed data are separate categories.
For a problem in your result, preserve original recording, race number and precise question, then use official event channels. Understanding performance aims at clarification rather than filling gaps imaginatively. The same approach applies to others’ data.
Make a short, verifiable marathon analysis
The final worksheet need not be complex. Start with original source and timing basis, followed by cumulative times and actual section distances. Add subtracted section times and consistent average paces, then essential event notes and uncertainty. Others can follow the conclusion’s steps.
Limit interpretation to precise statements: middle sections were similar; times gradually increased after kilometre 25; the short finish showed another pace; one window included a stop. These say more than one label applied to the race. Mark any assumed explanation separately.
The split list thus stays useful and appropriately bounded. It shows the marathon’s broader shape, supports arithmetic and the next preparation question. It cannot tell the full running story between timing points. Good analysis is accurate precisely because it makes that limit visible.
Sources
- Dong and Li: marathon pacing patterns from splits.
- Smyth: large-database analysis of late marathon slowing.
- Garmin: processing FIT activity files.
- B.A.A.: 2026 Boston Marathon rules.
How Futószív articles are prepared: our editorial guidelines.