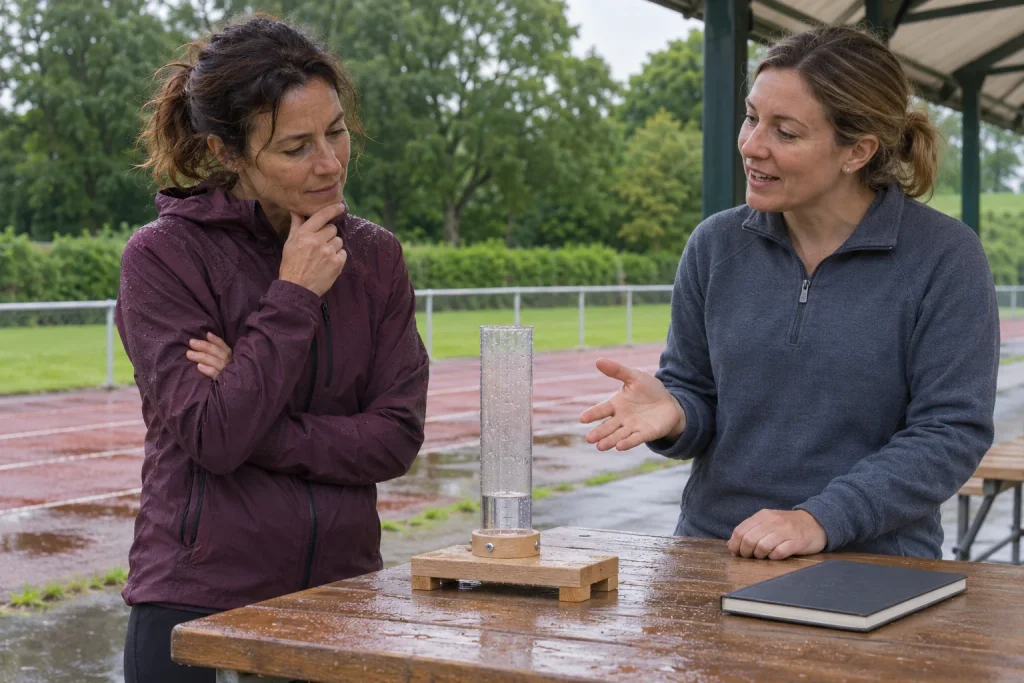
One weather display says 5 mm, another 5 mm/h. The number matches, but the information differs. The first may be rainfall accumulation over a specified period; the second may describe rainfall rate, or intensity. Omit duration and you can mistake two different data for the same thing. Before running, precipitation’s distribution through time and which part of your outing it meets may be precisely what matters.
Understanding units does not require buying weather equipment. Distinct concepts and clear calculations help organise app values. The calculations below are original hypothetical examples, rather than actual weather-event data or personal forecasts. They identify no precipitation limit below which every route is appropriate. The aim is to read precisely which quantity an interface reports.
What does a millimetre of precipitation mean?
The HungaroMet meteorological basics explain precipitation quantity through the thickness of water that would form on a horizontal surface without runoff, infiltration or evaporation. One millimetre over one square metre equals one litre. An accumulation of 5 mm therefore does not mean water will stand precisely five millimetres deep on every pavement. The meteorological quantity differs from the height of water collected in an actual depression.
The volume relationship is easily checked: one millimetre is 0.001 metres; multiplying by one square metre yields 0.001 cubic metres, or one litre. In an original theoretical example, 5 mm of water applied evenly across a horizontal two-square-metre surface has a volume of ten litres. Surface area and water depth must be specified together. We have calculated neither raindrop diameter nor water entering a moving runner’s clothing.
The period is essential alongside accumulation. It may be the previous hour, a day or several days, and may represent measurement or a future estimate. For 5 mm today, find which interval the provider calls today. A past daily accumulation and an estimate for the next three hours do not become identical because both use millimetres. Quantity and validity together form the full statement.
Per-hour units express a rate
The Australian weather service explanation separates precipitation depth from intensity per unit time. For average intensity, accumulation is intensity multiplied by duration with consistent units. Thus 5 mm/h does not necessarily claim such rain fell or will fall for a full hour. The provider defines the measurement or estimation interval underlying the displayed rate.
In an original example assuming a constant rate, twelve minutes at 5 mm/h yields 5 × 12/60 = 1 mm. The same rate for thirty minutes gives 2.5 mm, and sixty minutes 5 mm. Twelve minutes was first converted to hours: 12/60 = 0.2 hours. The calculation works because the example assumes an unchanged rate throughout the period. One instantaneous display does not establish that constancy for the next half-hour.
Working backwards, average intensity is accumulation divided by duration. A theoretical 5 mm over half an hour averages 10 mm/h; over two hours, 2.5 mm/h. An average over the whole period does not claim identical rain in every minute. This distinction helps runners too: a daily accumulation does not directly reveal the rainfall rate during twenty particular minutes outdoors.
 Enlarge image
The same amount can arise from three different timing patterns
The three stories below are original mathematical illustrations. Each totals 5 mm, but the timing experienced while running would differ. Constant sections simplify calculation; actual precipitation need not follow such a step pattern. The point is that one final total does not contain all temporal detail. We do not rank the rows for individual comfort or danger.
| Imagined pattern | Calculation | Amount |
|---|---|---|
| 5 mm/h for a full hour | 5 × 1 hour | 5 mm |
| 15 mm/h for twenty minutes, with no precipitation before or after | 15 × 20/60 hours | 5 mm |
| 2.5 mm/h for two hours | 2.5 × 2 hours | 5 mm |
For the second example, choose a full one-hour assessment window: the first twenty minutes at 0, middle twenty at 15 and final twenty at 0 mm/h. The hourly average is 5 mm/h while the greatest intensity among those sections is 15 mm/h. The middle value cannot be reconstructed uniquely from the average. Hourly average and a shorter interval’s peak therefore provide separate information rather than interchangeable names.
Shifting a run’s timing could change its encounter with rain in these examples, but accumulation does not identify a certain dry departure minute. That needs actual temporal forecasts and current conditions. The table is not a timing trick, but an example of lost information: summarising simplifies a detailed history. Do not attribute hourly detail to daily data when the display does not provide it.
Ten-minute data can also be expressed in mm/h
The NOAA buoy-data instrument documentation offers an example of the connection between window and unit: ten-minute rain intensity is expressed in mm/h, while hourly accumulation is in mm. Ten-minute names the sampling period; per-hour units express the rate. This documents one data system rather than defining every phone app. It illustrates why ten-minute does not automatically require a display in mm per ten minutes.
In an original example, a ten-minute average of 6 mm/h means 6 × 10/60 = 1 mm during those ten minutes. If the next ten-minute average is zero, that adds zero millimetres for the next section. Together they total 1 mm, rather than 6 mm. Convert to the same quantities before adding. Merely summing intensity values without durations does not correctly calculate accumulated precipitation.
Consult documentation for the meaning of a screen timestamp too. A value may relate to a window starting, ending or otherwise associated with the time. Do not invent its meaning because a phone shows a whole hour. In personal comparisons, shifted time windows alone may change what enters a summary. Precise comparison needs the associated definition as well as the number series.
You may see radar-estimated intensity and surface-measured accumulation
The Hungarian radar-network description separately discusses intensity estimated from reflectivity and its accumulation over time. It also describes aggregation problems arising from discrete measurements, particularly for rapidly changing moving systems. A radar snapshot is therefore not simply a counter of millimetres certain to fall over the next hour. Data origin and processing belong to interpretation even when a phone shows different layers against one consistent background.
In comparisons, name the product viewed: radar-estimated intensity, an accumulation map for a period, station data or a forecast. Common units do not erase different methods. A point measurement and a map area need not describe the same environment either. When values differ, compare place, time and product before trying to understand remaining disagreement.
You need not produce your own radar rainfall total from a few saved pictures after running. Multiplying values estimated from colours by the whole outing’s duration does not resolve unknown changes between samples. A provider’s appropriately described finished product better serves that purpose. In your diary, record what you actually know: when you encountered rain, what you carried and which modification worked.
Meteorological millimetres are not the depth of water collected on a route
The definition of accumulation separates fallen water from effects of runoff and infiltration. A real route slopes and may include depressions, drainage and covered areas. App millimetres therefore cannot directly calculate standing-water depth in an underpass or beside a kerb. Treat current route usability as separate information rather than an assumed copy of a meteorological number.
Even a small-looking daily total does not justify testing a flooded section. Displayed millimetres alone do not reveal submerged obstacles, conditions or local water circumstances. A detour or changed outing is a route decision tied to local conditions. Do not use precipitation amount to declare a closure or a section you cannot assess usable after all.
Do not directly compare a jacket’s hydrostatic-head value with this rain figure either. Test pressure reported for clothing waterproofness differs physically and methodologically from precipitation accumulated over time. Both including the word millimetres does not make subtraction meaningful. The jacket withstands this many millimetres, so this much daily rain is fine is not appropriate equipment arithmetic. Learn clothing’s own instructions and intended purpose separately.
 Enlarge image
Design precipitation data are not today’s running-weather forecast
The HungaroMet precipitation-intensity interface provides design intensities for planning and sizing based on measurement series. It may also use mm/h, yet its task is not reporting rain expected in the next hour that day. Identical units can concern different time scales and professional questions. Arriving from a search engine, read the product purpose first rather than extracting a value beside a place name as a current running forecast.
Save current observations, forecasts and educational descriptions separately in your own information routine. This avoids accidentally glancing at a climate series or example map during a quick pre-departure check. A description supporting understanding may remain useful longer, while a current number is time-specific. The sources serve different roles even on the same weather service website.
Four questions beside rainfall data
Which quantity are you viewing: accumulation or intensity? For which period and place? Is it measured, processed or forecast? Which further weather and local-route information does your outing need? These turn a unit into meaningful information. You need not recalculate the table before each run, but quickly checking unit and window is more precise than automatically treating matching numbers as matching situations.
5 mm and 5 mm/h can therefore be connected when duration and averaging conditions are known, but are not interchangeable. The same accumulation can arise from different intensity patterns, while one rate cannot predict wetness throughout your run. After reading accurately, still adapt the outing to actual surroundings. The numbers support understanding rather than become unsupported guarantees imposed on every part of a route.
Sources and original calculations
HungaroMet: meteorological basics – precipitation quantity and water-layer depth. Bureau of Meteorology: IFD system and units – the relationship between accumulation and intensity. NOAA National Data Buoy Center: measurement data description – a specific example of ten-minute intensity and hourly accumulation. Hungarian radar-network description, 2023 – radar-estimated intensity and accumulation over time. HungaroMet: design precipitation-intensity data. The table and every numerical situation are original theoretical calculation examples, rather than measured running events or current weather data.
How Futószív articles are prepared: our editorial guidelines.