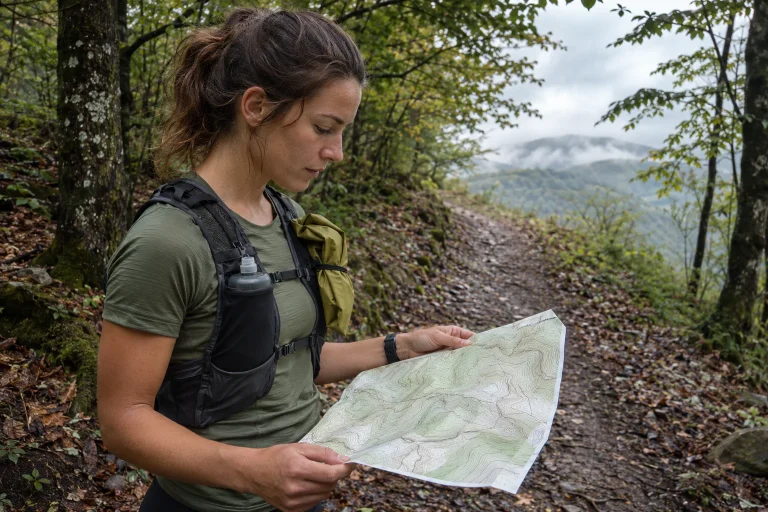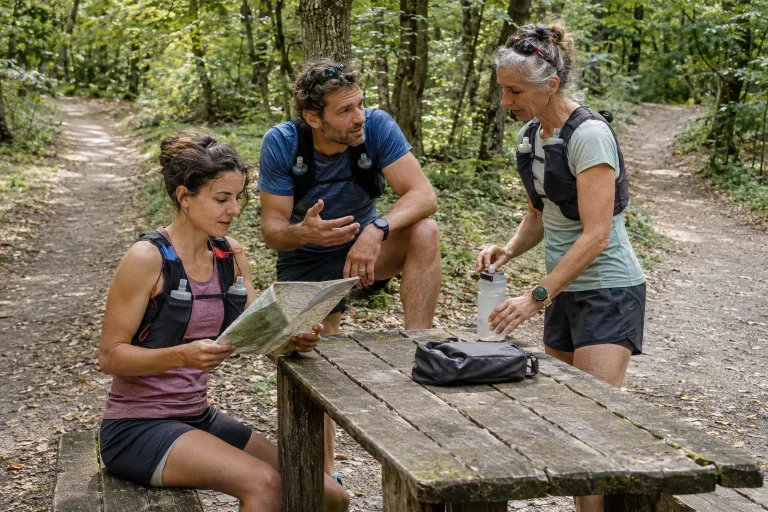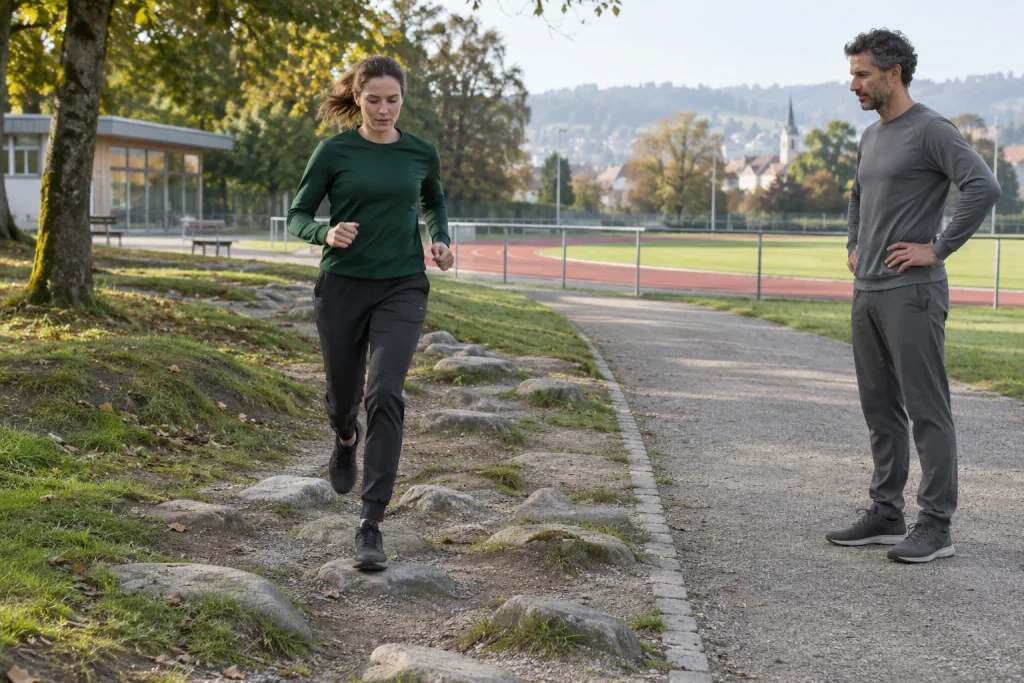
The ground does not sink beneath your shoe, yet running feels harder. Dried wheel ruts, small stones or successive little height differences set a different task from smooth tarmac. In this situation, “the ground is softer here” may miss the point: the surface’s shape alone can change how the runner operates.
This article follows the specific question of unevenness. We examine how experiments can separate geometric variation from material compliance, what step variability reveals, and why one percentage cannot be copied onto your forest loop. Among the original studies are findings of additional cost and findings of little change. Understanding that difference is more useful than a general claim that every bump slows you by the same amount.
Unevenness has height, density and shape
You can call two surfaces bumpy even though their structures differ completely. One has large, rounded undulations; another has small, closely spaced protrusions. A third puts a few sharp edges between broad, flat areas. Height difference is only one variable. The same difference over a longer or shorter distance creates a different surface slope and foothold.
Meanwhile, hardness can be identical. A low element fixed to a rigid wooden board does not become softer because the foot lands on a non-flat section. The reverse is true too: an evenly compressing rubber layer can be smooth. A clear research question is therefore what changes when surface geometry is modified on the same base material at a similar running speed. The word “terrain” bundles together many more conditions.
The arrangement of the elements is also part of the task. Always knowing where the next foot will land is a different situation from a changing, partly concealed path. You can adapt to a test course’s repeating pattern; outdoors, patches of light, leaves and other runners can also influence what you see ahead. When interpreting a scientific article, a photograph and description of the surface’s construction are therefore often more important than an impressive “trail running” label.
What can be held constant to compare shape itself?
In our imagined experiment, one runner moves at the same speed over a base surface. First there is a flat section; then low, fixed protrusions are added to the same base. With everything else similar, the change can be linked more clearly to the new geometry than when comparing tarmac with deep sand. In the latter comparison, surface shape, shifting grains, energy loss and grip would all differ simultaneously.
Holding conditions constant does not mean every human movement remains unchanged. Adaptation of movement may be precisely what is measured. Speed and a prescribed rhythm can be maintained while the ankle or knee moves differently. If the researcher also marks where to place the feet, another degree of freedom is restricted. The study then asks how the runner solves that defined task, rather than how they choose a completely free line along a trail.
In Bettega and colleagues’ experiment, ten adults ran a figure-of-eight-like route under an even condition and a condition made uneven with fixed hemispheres. A metronome assisted rhythm, and markings guided foot placement in the flat condition. The uneven version produced an 18 per cent higher oxygen cost and a 23 per cent higher energy cost, with increased activity in tibialis anterior and peroneus longus. This is the result of a specific laboratory task, not a fixed surcharge for any forest path.
 Enlarge image
More varied steps do not necessarily mean a wider average step
On uneven surfaces, average step width and variability in step width are importantly different. If some steps become narrower and others wider, the average may stay unchanged. The same applies to step length and landing position. Some variability may reflect adaptation to the local foothold. It makes little sense to label every difference inaccurate in a task that does not demand identical repetitions to begin with.
In our worked example, one sequence of four foot-placement widths is 18, 20, 20 and 22 centimetres; the other is 12, 18, 22 and 28. Both average twenty centimetres, but the second is much more dispersed. These are neither target running values nor research data. They show how an average can hide step-by-step adaptation. A single average on a display therefore does not fully describe how the route was negotiated.
In Voloshina and Ferris’s twelve-participant treadmill study, energy expenditure increased by five per cent on a surface with height variation up to 2.5 centimetres, at 2.3 metres per second. Step-length and step-width variability also increased. The authors used mechanical analysis to examine the contribution of stepping up and down. The experiment shows that even small height differences can produce measurable additional cost; that five per cent, however, belongs to this surface and protocol.
Changing one foot angle does not reproduce the terrain
Video of uneven-surface running can suggest an appealingly simple story: foot position changed, so changing just that will reproduce the same energy demand. In a complex task, however, the observed angle may accompany many other changes. The moment of contact, knee position, force development over time and preparation for the next support can all contribute to the response.
In Gantz and Derrick’s study, sixteen participants ran under uneven, smooth, and smooth-with-visual-feedback conditions that modified foot position. Moving from uneven to smooth reduced the rate of oxygen consumption. However, altering foot angle through feedback on the smooth surface did not produce a significant metabolic change. This distinguishes the complete environmental task from copying a single observed movement characteristic.
For the reader, this means there is no need to select a deliberate ankle position for the next tarmac session from a photograph taken after a forest run. Altering movement would be a separate intervention, with a different aim and consequences. To use an uneven route, first interpret the task: how familiar is the section, how visible are the footholds, and at what speed does progress remain predictable?
Why did another study find barely changed energy demand?
The 2023 research by Dhawale and Venkadesan examined an uneven surface with trail-like undulations. In this environment, runners did not consistently seek the most level footholds, and overall movement and energy expenditure changed little compared with the flat condition. The authors emphasised mechanical adaptation. This reminds us that uneven surfaces do not form one uniform loading category.
Different findings should not be blended into a single middle-ground percentage. Fixed laboratory hemispheres, repeating treadmill elements and an undulating trail-like surface can produce different contacts. Freedom of foot placement, speed and participants can differ too. Findings are useful when read alongside these conditions. The claim “science says every bump slows you this much” would omit exactly this essential information.
Likewise, two versions of your own trail loop should not be judged equally difficult solely from total elevation gain. Even two sections with zero net ascent can differ in the number of small up-and-down steps, lateral support and interruptions to rhythm. A large-scale elevation profile does not see what the shoe encounters over the next twenty centimetres. Both views are useful; they describe different spatial scales.
Equal pace and equal effort are different comparisons
Maintaining your tarmac pace on uneven ground asks: what does the same speed cost on this surface? Choosing comfortable, similar effort and allowing pace to vary asks a different question: what progress results from this chosen load? Both approaches can have training aims. Their results cannot, however, be interchanged as a single “better run” score.
In our invented illustration, you cover a smooth kilometre in six minutes and an uneven one in seven at the same comfort level. That is approximately 14.3 per cent lower mean speed: 8.57 rather than 10 kilometres per hour. Time per kilometre is 16.7 per cent greater. Even these basic ratios differ depending on what you divide by what; we have not yet called the change an energy demand. Pace alone cannot tell us whether you consumed the same oxygen.
Similarly, if a study finds an eighteen per cent higher oxygen cost at the same speed, it does not follow that you must slow by that percentage. That would require knowing your own cost–speed relationship on the particular surface and in your current condition. One measured point does not define the whole curve. Laboratory results help explain the phenomenon; they do not supply a personal trail pace for every bend.
 Enlarge image
A three-section route: our planning example
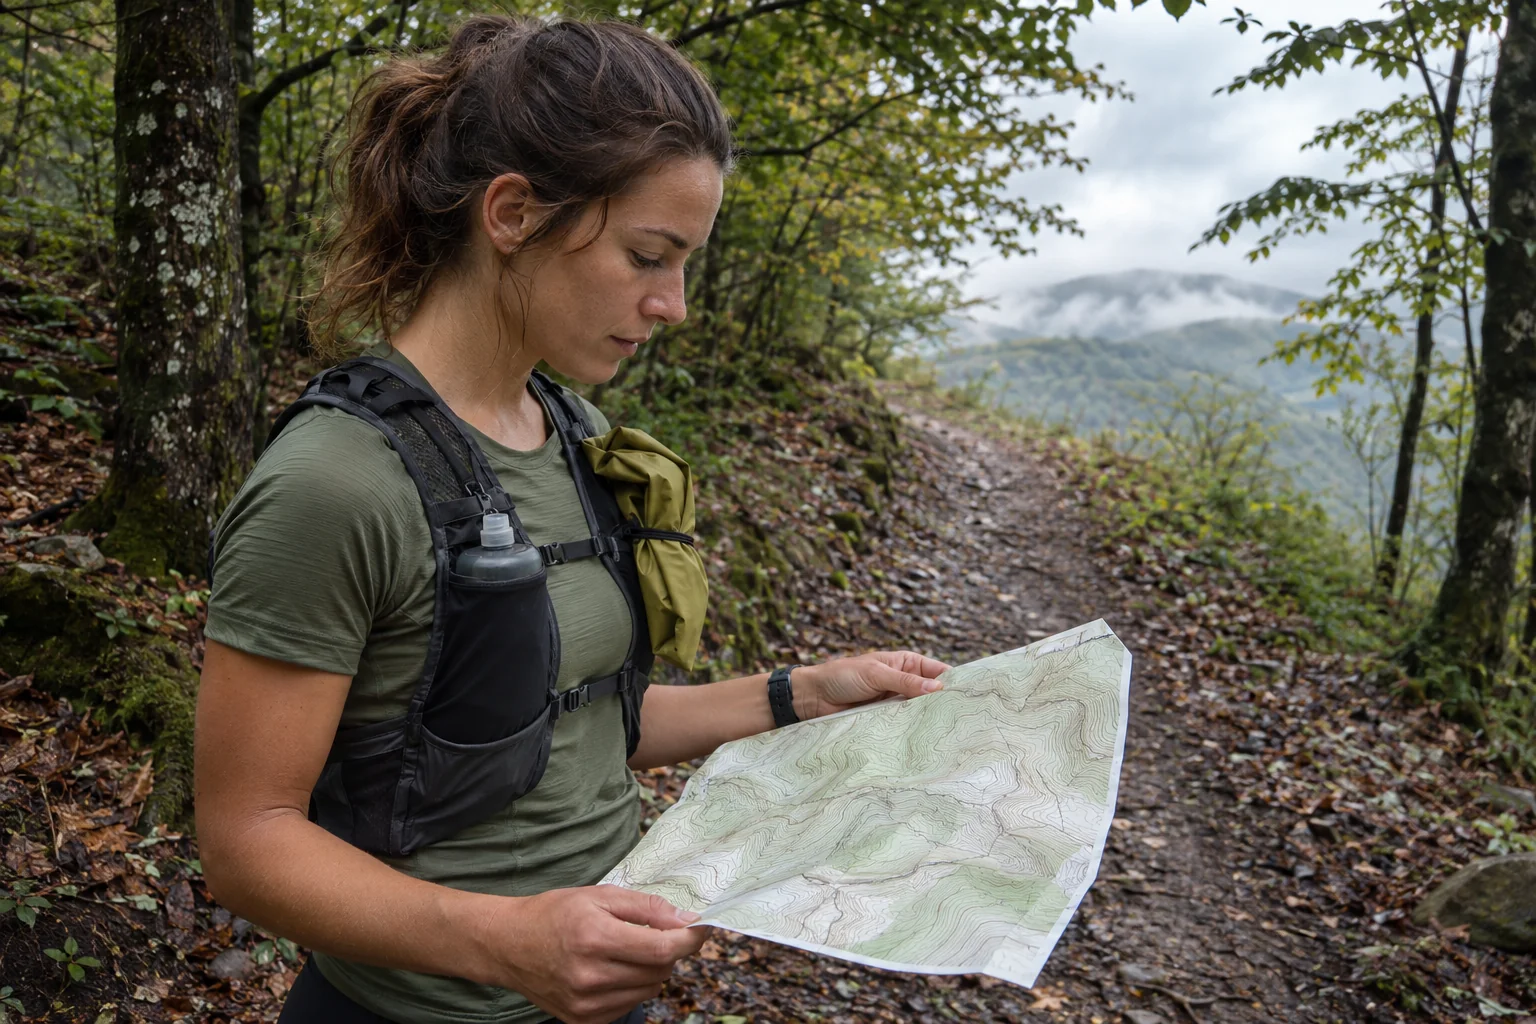
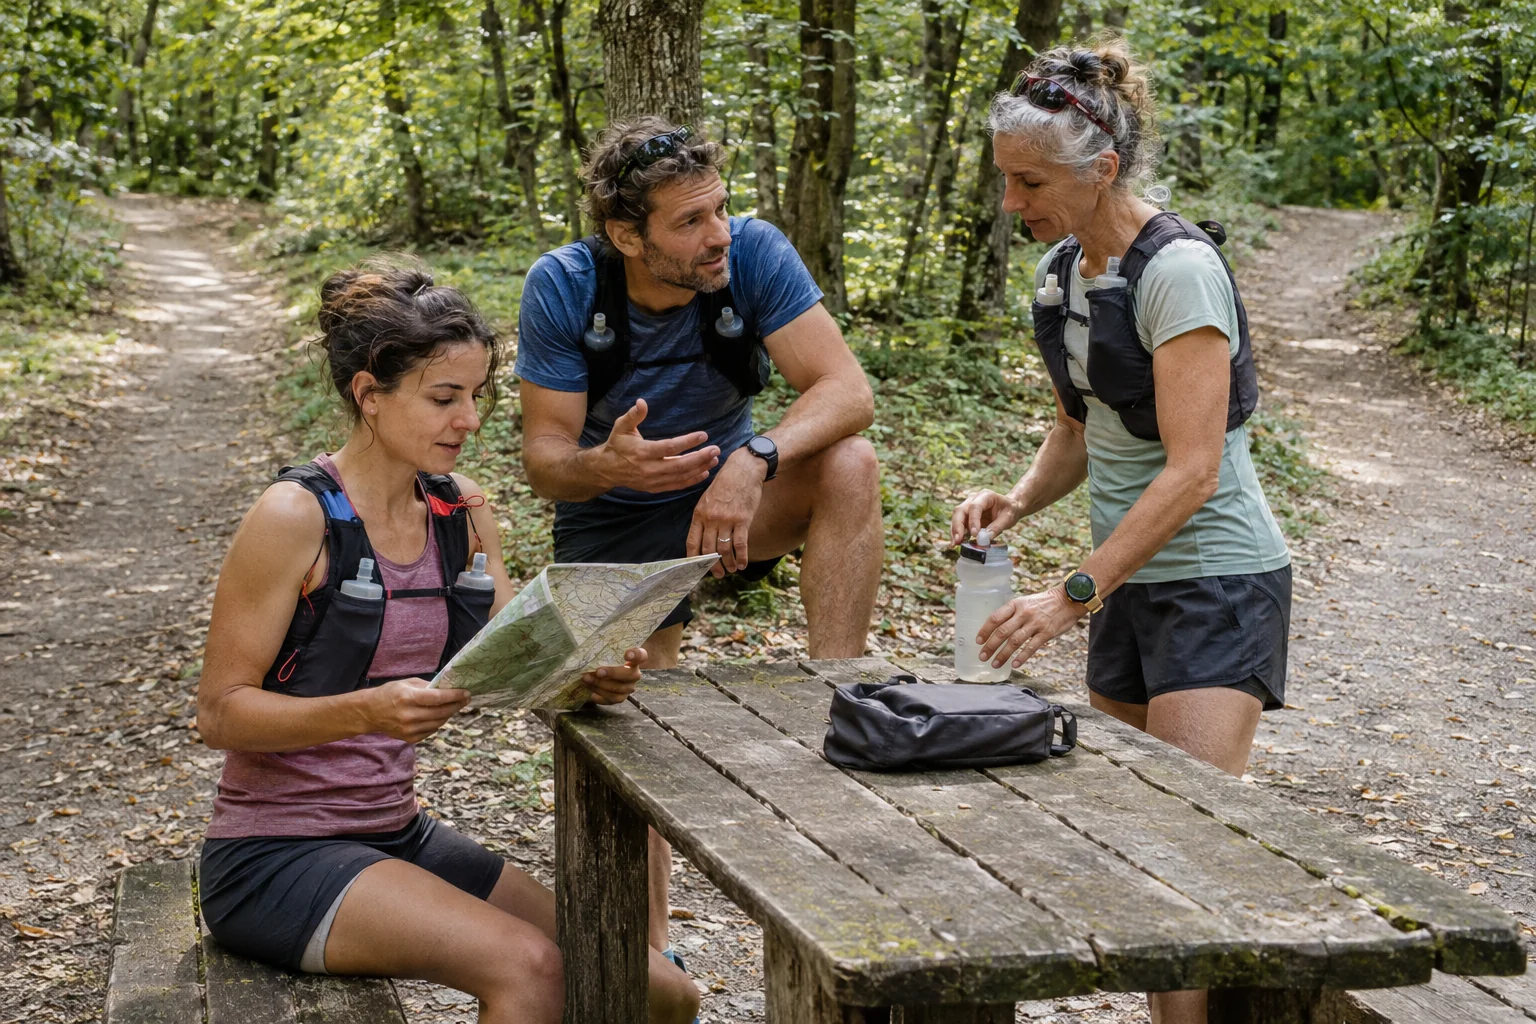
Imagine a five-kilometre loop: two kilometres of smooth access road, two of stony trail and one of wide, easily runnable dirt track. The aim is calm, continuous movement. Treating the middle part as its own task makes more sense than prescribing a tarmac average pace for all five kilometres. An easy rhythm on the access road can be followed by progress suited to the trail’s footholds, then a return chosen for how you feel at that moment.
Three separate log entries may say more than one average: time and feel on the smooth section, trail conditions and necessary interruptions, then the final kilometre’s experience. Stopping on the stony section to let a cyclist pass is not a deterioration in running economy. If rain has added mud between the stones, the task differs from a dry day too. Precise description helps avoid unfairly undervaluing your performance.
Keep questions of trail preparedness separate from pace too. Can you see the section ahead, is turning back possible, is there enough light, and how does the surface change when wet? These considerations may lead you to choose a shorter, more familiar route. Walking or slowing can be part of solving the terrain task, rather than evidence that your tarmac training “counts for nothing”. The two environments require different skills and decisions.
What should you check before accepting a new “terrain cost” figure?
First identify the surface studied: fixed elements or a natural route, what height differences, what repeating arrangement? Then identify the running task: fixed speed, metronome, prescribed footholds or a freely chosen line? Third, identify the result: oxygen-consumption rate, energy cost per distance, heart rate or simply section time? These are not synonyms and may use different units.
Fourth, establish the control condition. A smooth version of the same base? Another treadmill? A route made of an entirely different material? The first is closer to an isolated geometric comparison; the last compares whole environments. Neither is worthless, but the conclusions available differ. A fair summary names the change that was actually isolated.
Finally, set your own question alongside it. Planning next weekend’s relaxed forest loop does not require clinging to a laboratory percentage. If you want to improve in a trail race, familiarity with the surface, experience of local sections and training matched to the task offer more than an app value intended to correct everything. Unevenness can be a real additional task, but its form determines precisely what that task is.
Sources
- Bettega and colleagues: even and hemisphere-modified routes.
- Gantz and Derrick: uneven surfaces, foot-angle feedback and oxygen consumption.
- Voloshina and Ferris: mechanics and energetics of an uneven treadmill surface.
- Dhawale and Venkadesan: regulation of steps on an undulating, trail-like surface.
How Futószív articles are prepared: our editorial guidelines.