If a study finds a tailwind associated with better marathon results, how many minutes can we credit to our own race? Understanding the route, wind direction and research setting comes first. Original analyses of Boston, New York and Stockholm help show why a single weather coefficient cannot be transferred to every course.
Wind speed needs a direction of travel alongside it
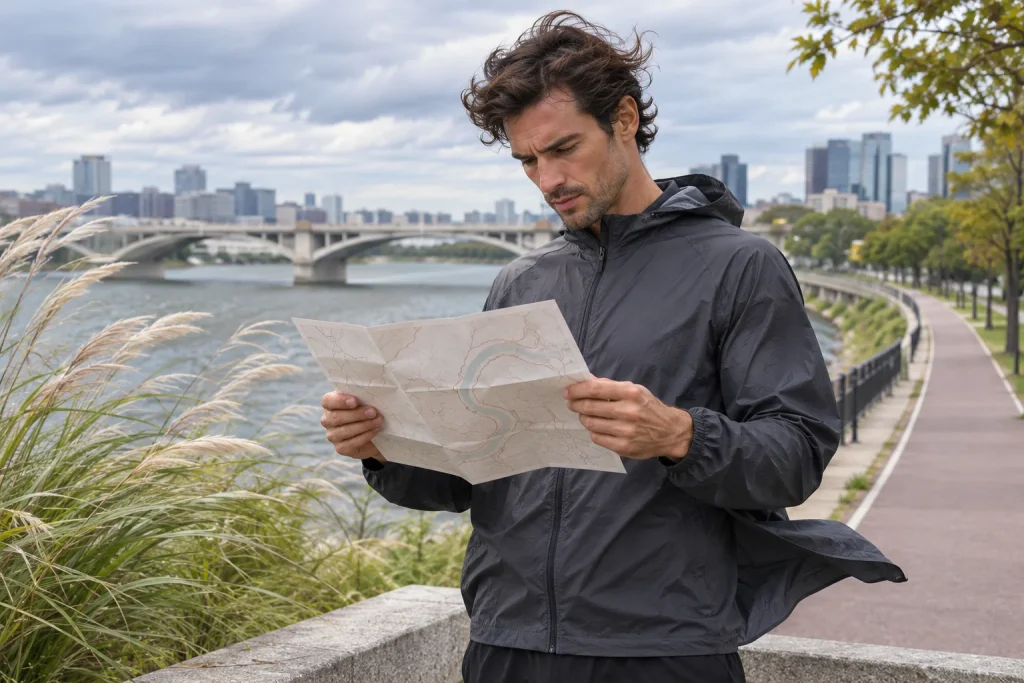
Meteorological data describes the direction from which air flows and how strongly in the stated environment. A runner adds their own direction of travel to this. The same wind can come from ahead, behind or the side on different parts of a route. Writing down a single wind speed for the whole marathon does not yet explain how the course encounters it.
The HungaroMet description of wind explains that wind direction is named for the compass direction it comes from. A westerly therefore arrives from the west. This simple detail can still cause many mapping misunderstandings if someone reads an arrow without checking whether it represents where air comes from or goes towards. Check your own app’s legend too.
On a fictional straight section heading east, a westerly comes from behind; on the return section heading west, it comes from ahead. Turning north changes the relationship again. We have not calculated a performance effect from the example; we have only established the geometry. This is the first necessary step before trying to use another city’s marathon regression as a personal time correction.
Boston’s course and New York’s streets raise different questions
The Boston Athletic Association official information describes the event as a point-to-point course. On such a route, the general direction between start and finish matters in interpreting wind direction. The course is still not perfectly straight, and one line drawn between start and finish does not replace every detail.
The New York organiser’s official course description presents a route through five boroughs with several bridges and changes of direction. The current description also notes minor course changes for 2026. A historical dataset and the current map are therefore not automatically the same document. The study period, the course then and the race route now planned each deserve separate checking.
The two venues’ wind data should consequently not be compared as if one large experiment took place on identical running courses. Urban development, open sections, turns and direction of travel all influence what general weather data means to a runner. This does not rule out comparison; it shows which background information needs to remain alongside percentages.
 Enlarge image
What did the Boston analysis find?
The study of Boston Marathon data from 1972–2018 analysed more than half a million completion observations. Alongside temperature, precipitation, WBGT, wind speed and wind direction, the model included several other variables. Tailwinds were associated with better performance in the groups examined, while greater wind speed showed an adverse association in several groups.
The two findings do not necessarily contradict each other. Speed and direction are separate variables: stronger wind in general differs from being classified as a tailwind in relation to the course. Read the analysis within the full model and particular setting. One isolated row can easily become a simple rule that no longer answers the original question.
Your own decision does not call for multiplying a study coefficient by the wind speed on your phone. The variable’s definition, its relationship to the route and comparison conditions would first need to match. The research association offers important information about the race environment, but is not a personal correction in seconds intended for every runner and course.
Why might the New York association look different?
The analysis of the New York City Marathon from 1970–2019 used more than 1.28 million finishes. In its models, higher temperature was associated with longer times, while greater wind speed and humidity were associated with shorter times. The authors also examined relationships by age and sex. This is not the same model or environment as the Boston analysis.
The result does not mean headwinds make you faster or that any wind benefits every environment. Weather variables can change together, and a historical race day contains several different conditions at once. A statistical association should not be renamed a direct mechanical effect while the course, period and rest of the model disappear.
The differing findings are precisely what make comparison interesting. The question is not which city’s study won the argument, but what was measured differently and in which environment. Retain this perspective and research helps you think about weather in greater complexity. Look for a universal wind formula and you may find a simple answer neither study established.
Stockholm’s example: variables moving together
The study of the Stockholm Marathon from 1980–2008 provides a useful cautionary example. According to the author’s analysis, certain simple associations of humidity and rain with performance arose from their negative relationships with temperature. It would therefore be misleading to report an isolated result as meaning rain or higher humidity alone certainly causes faster running.
An everyday example is similar: if cooler race days were also windier, a simple comparison struggles to separate which characteristic the better result relates to. Multivariable analysis tries to help with this, but does not automatically turn historical data into an experiment. Inputs, sample size and the chosen model still determine which conclusions a result permits.
A useful approach for readers is to place this question beside every strong claim: what else changed alongside this factor? A favourable weather association then does not become an independent cause too quickly. In sport, finding one environmental explanation for a major result is especially tempting, while the real race day consists of many connected conditions.
The field changes within a decades-long dataset too
A fifty-year race history contains differences beyond weather. Participant composition, participation habits, recording of results and equipment may all change. These are general interpretative questions, not claims that any particular study perfectly addressed or ignored every possible change. Check the methods to see which factors entered the model.
A finishers’ database also provides information about finishers. Those who did not start or did not complete require different data. An association concerning finishing time should therefore not automatically become a claim about the health risk of every event participant. Faster or slower performance and medical safety are different outcomes with different research questions.
A large, impressive sample does not remove all these limits. More observations may describe an association within a database more precisely, but transfer to another city still requires comparing environments. Hiding limitations does not increase the research’s value. It helps best when you can consider both similarities and differences from your own race.
 Enlarge image
A map and hourly forecast: a useful sheet of your own
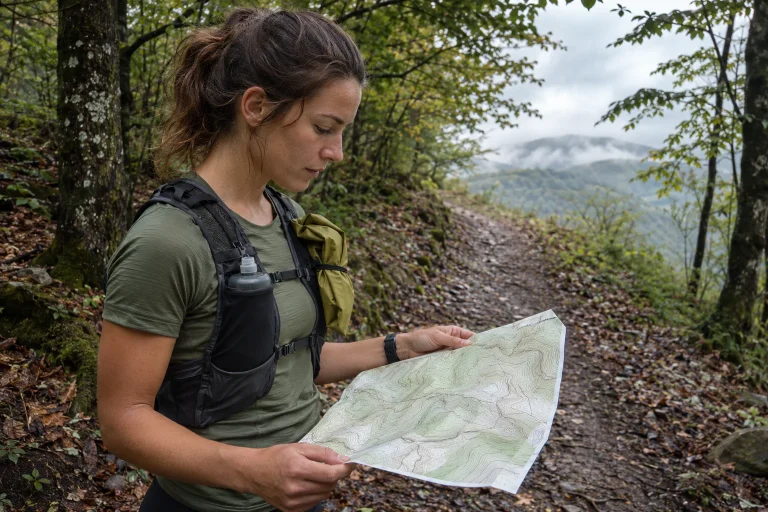
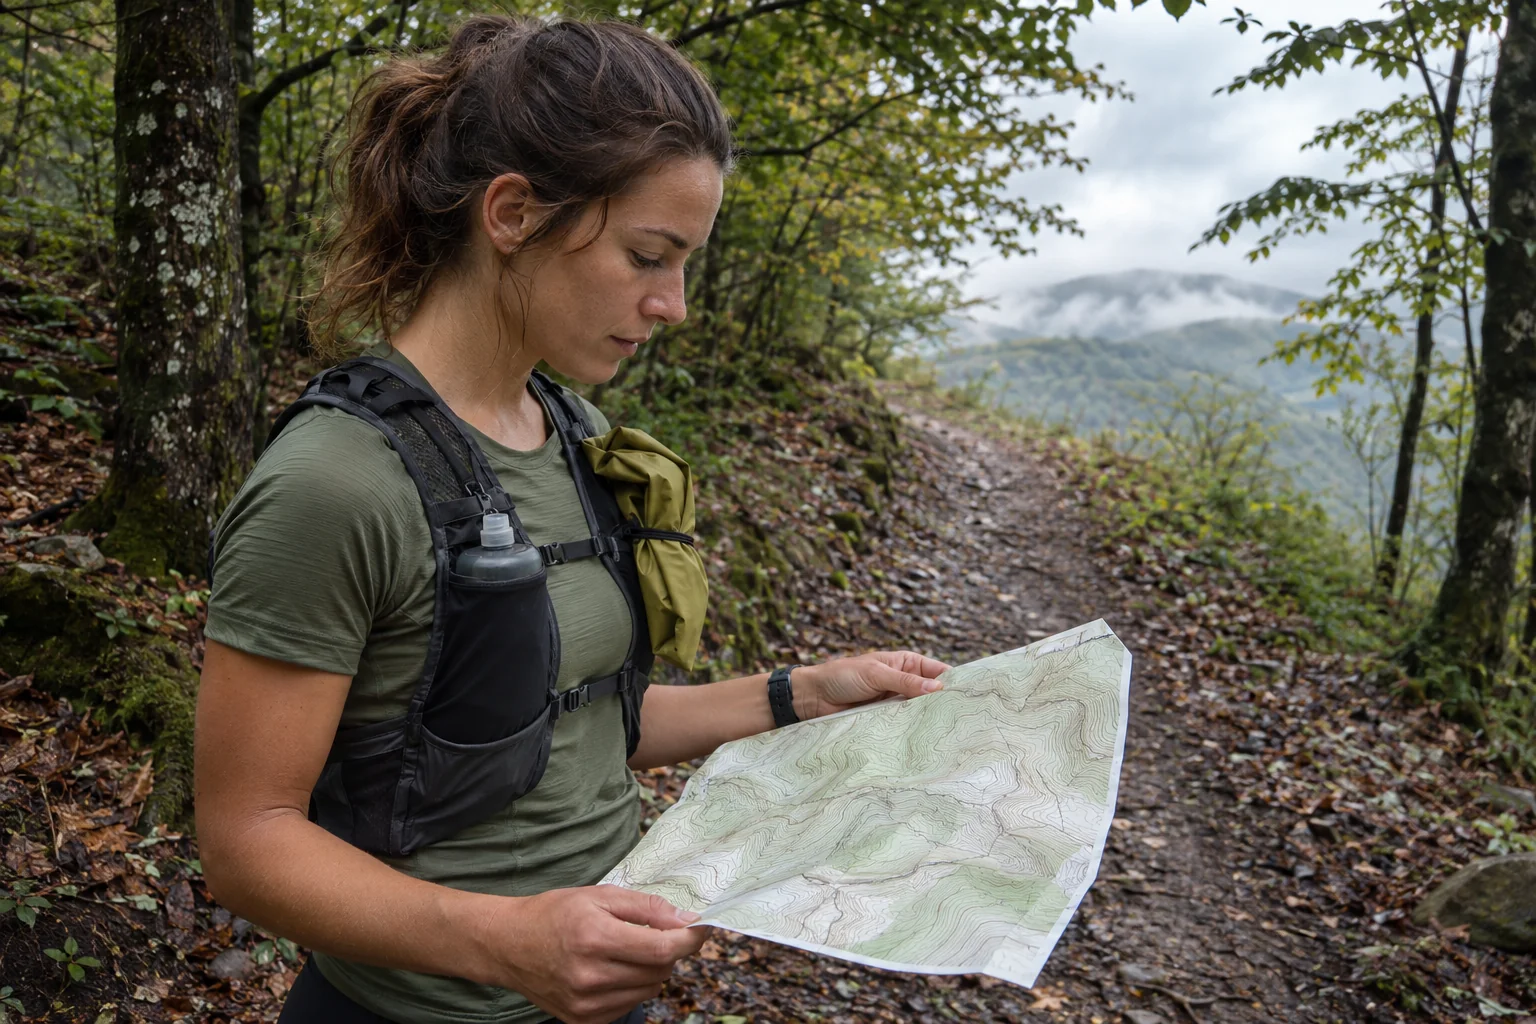
Open the chosen event’s current official map and identify a few longer sections with characteristic directions. Do not try to model every tiny turn. An open embankment, a bridge or a long avenue can already help interpret the general forecast. Add approximate passage times based on your own start and realistic time plan.
Then look at wind direction and speed during the relevant hours alongside temperature and other important conditions. The HungaroMet description also emphasises local obstacles and the surface in actual wind conditions. A town forecast is therefore not an exact picture of every street corner. Your sheet should offer approximate orientation rather than a course simulation with false precision.
Add two practical questions at the bottom: where might the relationship to the general direction change, and which official announcement might alter the plan? Do not assign automatic minutes gained to the word tailwind. Advance mapping helps you encounter fewer unexpected situations and know which conditions you are watching. Pacing decisions still need the whole preparation picture.
Match units too: five metres per second equals eighteen kilometres per hour. The two numbers describe the same speed, not two different strengths of wind. Applying a table’s coefficient would give an incorrect result if you kept its unit unchanged but inserted a number expressed in another unit. Keep average wind and gusts distinct when reading forecasts too.
Have a conditional plan instead of a wind correction
A conditional plan may be simpler and more honest than one corrected finishing time. For example, know which section is likely to be more exposed and where you need to reassess how manageable the chosen effort is. This is not rigid split chasing. A workable plan accommodates actual weather and on-site instructions, rather than only the ideal version of an earlier forecast.
Discuss specific situations with companions too, rather than a general advantage in seconds taken from a study. Moving together helps only if everyone can follow and it does not force someone into an unfamiliar pace. Adapting to the environment does not excuse unpredictable positioning or disregarding route rules.
Boston, New York and Stockholm’s data therefore provide three research stories from different environments rather than slogans cancelling each other out. Wind direction, the course, weather changing together and the field’s background all matter. Your own map and fresh official forecast together offer a more useful starting point than a correction borrowed from another event and assumed to apply to every marathon.
Sources
- Knechtle and colleagues: weather and the Boston Marathon, 1972–2018.
- Knechtle and colleagues: environmental conditions and New York finishers.
- Vihma: weather and the Stockholm Marathon, 1980–2008.
- HungaroMet: wind direction and local wind conditions.
- Boston Athletic Association: official course and spectator information.
- New York Road Runners: the current official course description.
How Futószív articles are prepared: our editorial guidelines.