A six-minute average pace, an average heart rate of one hundred and forty, forty kilometres in a week: a few numbers can almost become a ready-made story in a running log. Yet the same average can come from very different series. Steady running, accelerating sections, long stops and summaries of several workouts may look similar on the same card. This does not make averages bad data. They are brief summaries whose limits need understanding. Through arithmetic examples and log-reading questions, this article shows what to examine behind the big number. Examples are illustrative only, not prescribed paces, heart-rate targets or training plans.
First ask what is being averaged
The entire activity, one lap, the last kilometre and a rolling window are different sets. The Garmin Forerunner 570 data-field description distinguishes several lap, activity and rolling averages, for example. A short display label does not always reveal the full meaning immediately. Clarify the section being examined using your own manual. The same value in one field may summarise the whole workout and in another only the part just completed.
Units and the time basis belong to the definition too. Pace in minutes/km and speed in km/h cannot be averaged in the same way simply by adding displayed numbers. An average calculated from moving time may differ from one using all elapsed time too. Before comparing values, identify the data, period, unit and pause handling. These four questions prevent many misunderstandings. Later detailed analysis has a stable foundation only when summary fields mean the same thing.
For average pace, add time and distance
If you complete one kilometre in five minutes and the next in seven, total time is twelve minutes, distance two kilometres and average pace six minutes/km. Here a simple arithmetic mean of the two paces gives the same answer because the sections have equal distance. You cannot transfer that equality to every division, however. The reliable basis is selected total time divided by its corresponding total distance. With unequal sections, weight paces by the appropriate distance or return to total time and distance.
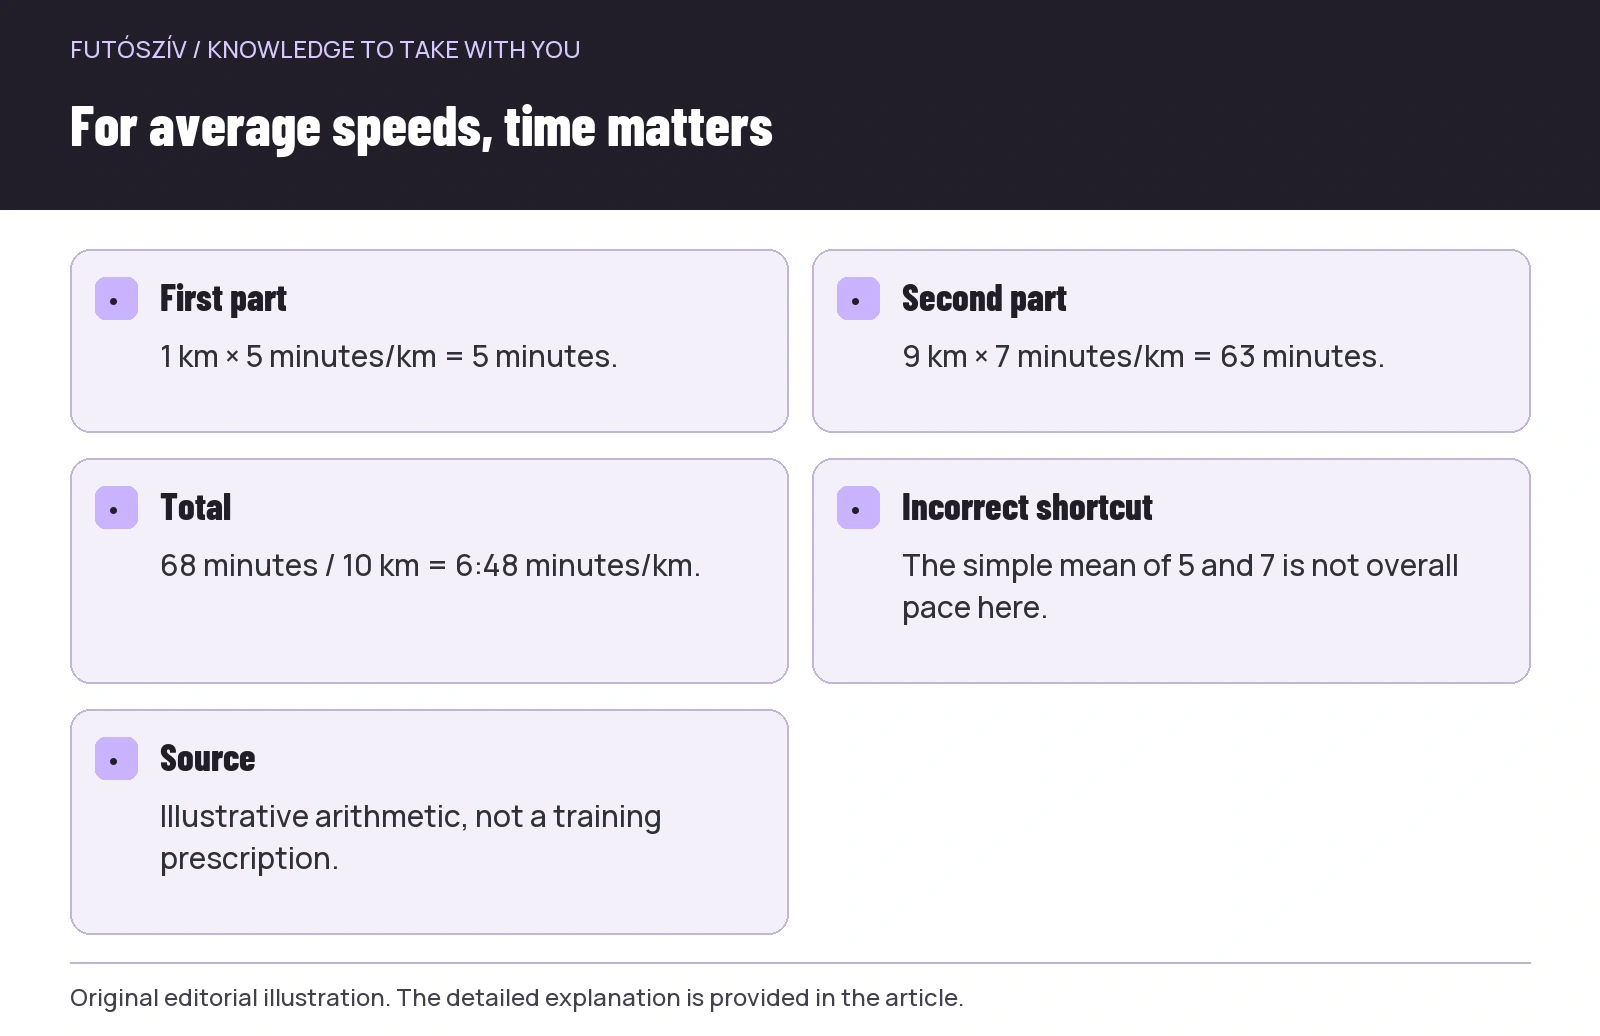
Take another illustrative division: one kilometre at five-minute pace, then nine kilometres at seven-minute pace. The first part takes five minutes, the second sixty-three, totalling sixty-eight minutes for ten kilometres. Overall pace is six minutes forty-eight seconds/km, not six minutes/km. Simply averaging five and seven would give the short opening part too much weight. The same problem can arise with weekly pace averages if you give equal weight to the summary paces of a short and a long run. Individual run averages do not automatically yield the correct weekly average.
For average speeds, time matters
Speed is distance divided by time. With equal-duration sections, a simple mean of speeds may suit the combined sections, but equal-distance sections differ. In an illustrative example, one kilometre at ten km/h takes six minutes and one kilometre at fifteen km/h takes four. Two kilometres take ten minutes, making overall speed twelve km/h. Simply averaging ten and fifteen gives twelve and a half, which is not the whole route’s average speed here. The difference follows from unequal section durations.
You do not need formulas after every run to use this. The practical rule is to know how long displayed partial averages lasted and what distances they concern before combining them. If total time and distance are available, their ratio offers a clearer starting point. The Strava pace and speed description also distinguishes views of the entire activity and sections. Interpret a platform summary under its own definition, especially when pauses or subsequent processing appear in the recording.
 Enlarge diagram
Text version of the illustration
- First part
- 1 km × 5 minutes/km = 5 minutes.
- Second part
- 9 km × 7 minutes/km = 63 minutes.
- Total
- 68 minutes / 10 km = 6:48 minutes/km.
- Incorrect shortcut
- The simple mean of 5 and 7 is not overall pace here.
- Source
- Illustrative arithmetic, not a training prescription.
Sequence disappears in an average
Five equal kilometre sections may take seven, six and a half, six, five and a half, then five minutes/km. Reversing the same five values gives the same total duration and average. In one story the sections get faster; in the other they slow down. The average does not show this. To interpret sequence, examine the lap list or timeline alongside the route and task. The difference need not immediately become a judgement: changes may be deliberate in a run built around climbs or separate tasks.
The overall average may be especially insufficient for understanding the final part. A long, slow warm-up remains in the total summary and only partly reflects a current section’s change. If asking how a specific task went, select its section. Use the complete activity when genuinely asking about the whole run. Changing views is not falsifying data, but choosing resolution suited to the question. The problem is presenting a selected section as the whole run without labelling it.
Average heart rate is not the complete timeline either
In an arithmetic illustration, the value stays at one hundred and thirty for thirty minutes, then one hundred and seventy for ten minutes. The time-weighted average is one hundred and forty: the longer section carries more weight. Simply averaging the two section means gives one hundred and fifty, which is not the appropriate average for the whole forty minutes here. This only explains averaging; it is not a real physiological measurement or target zone. Actual device sampling and handling of gaps add further details. Know the field displayed and examine the curve to interpret your own recording.
One average does not reveal whether the data was steady, when it changed or whether a substantial section was missing. Average heart rate is neither a diagnosis nor a complete judgement of training. If you suspect a graph section is a technical fault, flag and investigate it specifically rather than simply deleting inconvenient values. Record how you felt separately in text with its own meaning. Technical checks and clarifying health complaints are separate tasks; a prettier summary replaces neither.
| Summary number | What can it hide? | Which view complements it? |
|---|---|---|
| Average pace | Unequal section length, sequence and pauses | Time/distance basis, lap list and timeline |
| Average heart rate | Changes and missing sections | Time-based curve and data-quality label |
| Average run length | The influence of one unusually long session | Individual list, median and range |
| Weekly average | Different sports, routes and time windows | Sport-specific filters and consistent date logic |
| Maximum value | A brief or faulty spike | That point’s context and duration |
Missing data is not necessarily zero
If a sensor supplies no usable value for a section, the platform may handle it in different ways. There may be a blank, a display interruption or other processing; clarify this from your own service’s description and recording. Manually entering zero for a gap makes a different mathematical statement from having no data. Simply excluding the missing period from the mean is different again. Coverage therefore matters alongside an average. A card full of percentages does not automatically reveal how much reliable underlying data supports it.
Do not unthinkingly treat an average from a twenty-minute part as a summary of a forty-minute recording. If the sensor stopped providing data precisely in the second half, the remaining values concern a different part. Note the duration and affected section. Do not fill it with data from another run or a curve drawn from memory, then present it as original measurement. Honestly flagging a gap preserves the framework for using the series. Evaluate an uncertain average later only with that known limitation.
One large value can pull an average
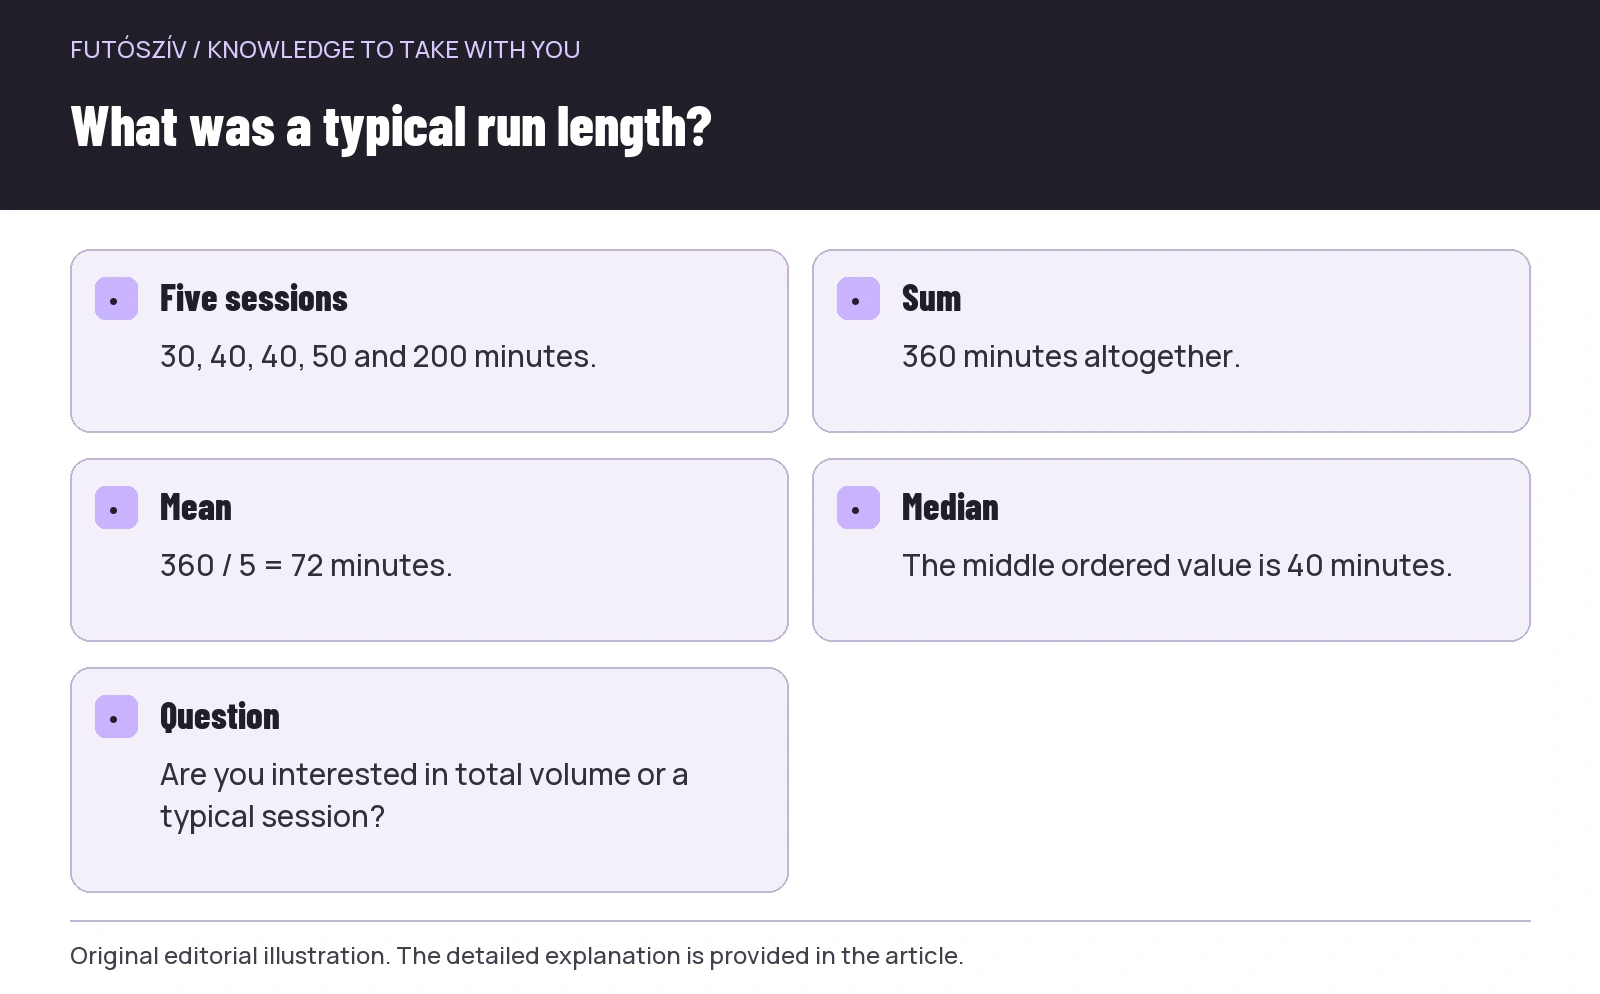
Five illustrative runs last thirty, forty, forty, fifty and two hundred minutes. Their sum is three hundred and sixty and simple mean seventy-two minutes. Yet four sessions lasted fifty minutes or less. The seventy-two-minute “average run” therefore does not resemble most sessions. The middle value in the ordered series, the median, is forty minutes here. The two measures give different views; the median does not erase the long session’s importance, but answers another question. Viewing the list still matters because it reveals the actual structure.
The NIST statistical information also highlights that extreme values affect the median less than the arithmetic mean. This does not make the median the correct choice for every running metric. If summarising total time volume, the sum and mean both have clear roles. If interested in a typical session, the median and individual list may help. Choose the measure for the question rather than switching merely because one creates a more favourable impression.
 Enlarge diagram
Text version of the illustration
- Five sessions
- 30, 40, 40, 50 and 200 minutes.
- Sum
- 360 minutes altogether.
- Mean
- 360 / 5 = 72 minutes.
- Median
- The middle ordered value is 40 minutes.
- Question
- Are you interested in total volume or a typical session?
Do not read different run types as one homogeneous group
A week’s average pace may change because you recorded more easy running, trails or sessions of different lengths. This is not necessarily the same as a change in comparable tasks. To ask about your progress, find recordings comparable and relevant to the goal while considering conditions. You cannot visually separate the effect of workout composition cleanly from the whole weekly mean. Group proportions matter within an average too. Filtering should select data belonging to the same question, not hide uncomfortable runs.
Pay particular attention when changing routes. Running more often in hilly forests instead of flat roads may change the whole log’s pace average while the runs’ purpose changes too. A separate label or note helps trace the shift. Do not invent an automatic terrain-conversion formula without a suitable basis. Grade-adjusted pace is also a model-based estimate, not perfect removal of every condition. Deliberately distinguishing data types and routes often helps more than calculating ever more averages.
Axes shape the graph too
Two charts can make the same change look dramatic or barely visible through different vertical scales. Time-axis length and smoothing also shape the story you read. Examine labels, range and selected section before drawing conclusions. A close zoom helps inspect a brief event but does not show its proportion of the whole run. A broad view may hide a small detail. Together, the two resolutions may be more useful than either alone.
If sharing a screenshot, state the question and selected period in the explanation. Do not show only a curve with cropped axes asking “what happened here?”. Without context, source and task, much guessing may follow. Use the same approach for your own analysis: after the big average, examine the whole picture, then the relevant part. This sequence helps avoid judging the entire run from a brief spike or obscuring the section of interest behind a full average.
Five questions behind the average
Which data produced it? How much time or distance does each part represent? What sequence and variation remain hidden? Are any points missing or questionable? Does the selected summary genuinely answer my question? You need not turn these five filters into a lengthy report for every workout. Use them when an unexpected number tempts a substantial conclusion. A well-phrased question often needs a simple view change: lap list, timeline, individual outings or checking the calculation basis. More data is not always needed, but the right resolution is.
An average remains a useful shortcut in the log when you do not expect a complete story from it. It helps you orient yourself quickly, then points towards closer examination of the recording. Understanding weighting, sequence and data quality makes numbers less misleading. The goal is not to make every runner a statistician, but to recognise the structure of their runs behind an average pace or weekly summary. This makes data reading practical: fewer hasty judgements and more precise, answerable questions.
Sources and further reading
- Garmin Forerunner 570 – Data Fields
- Strava – Pace/Speed
- NIST – the median and the effect of extreme values
How Futószív articles are prepared: our editorial guidelines.