Read first what the splits actually measured
After a race, a coloured graph offers a quick story. You went well here, fell apart there and almost recovered at the end. Sometimes that story fits; at other times, it mixes different data, memories and assumptions. Useful analysis therefore begins with clarification rather than judgement: where the number comes from, which section it covers and what you can reliably add alongside it.
This article focuses on checking and interpreting split data. It does not build an individual training plan from one race or derive health conclusions from a slower kilometre. We assemble a worksheet you can review with a coach where needed, keeping question marks visible rather than removing them for a pretty table.
Three layers: data, event and explanation
Data may be an official intermediate time or a watch-recorded lap. An event is something that happened on the course: stopping, reaching a junction, changing direction or a change in the field’s movement. An explanation concerns why the section unfolded that way. Keep these layers in separate columns.
| Layer | Example | What certainty belongs to it? |
|---|---|---|
| Measured data | The official five-kilometre checkpoint time | The source and interpretation of the measurement can be checked |
| Observed event | I stopped at the aid station | Personal observation, preferably recorded briefly |
| Assumed cause | This made the entire next section slower | An explanation to investigate, requiring further context |
Naming an event does not independently prove its full effect. If the section contained an aid station and a climb, you cannot certainly allocate every second of difference to one or the other. Stating that several components may explain a discrepancy and cannot be reliably quantified can itself be precise analysis.
Derive section times from cumulative times
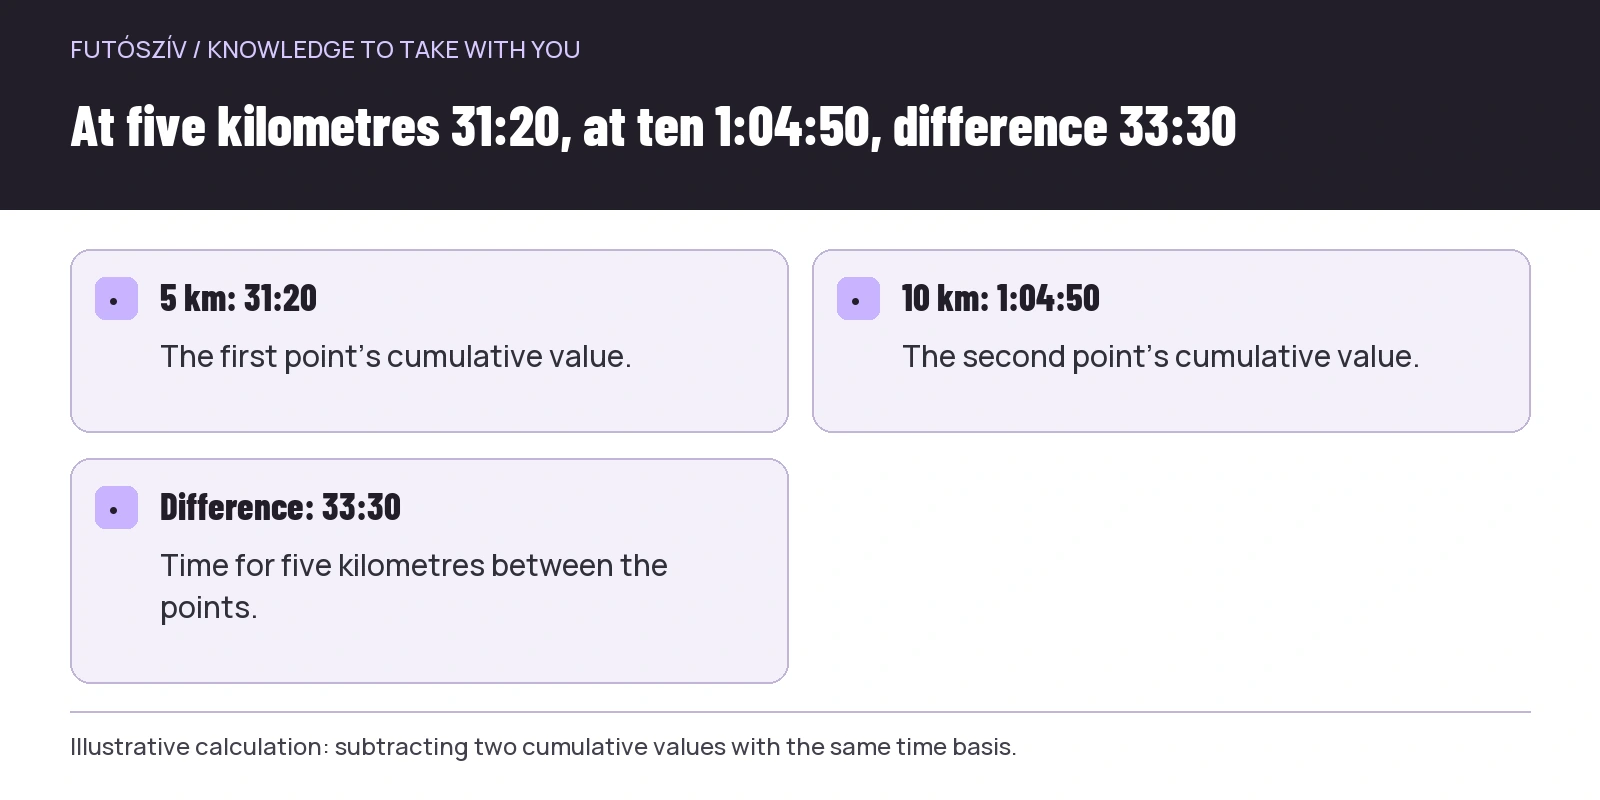
An intermediate-point table often shows time since the start. If five kilometres reads 31:20 and ten reads 1:04:50, the second five kilometres did not take 1:04:50, but their difference: 33:30. In this example, the second section therefore took 2:10 longer than the first.
This is an original illustrative calculation, not one runner’s result. It clarifies the operation. The two five-kilometre average paces are 6:16 and 6:42 minutes/kilometre. We still do not know why the race unfolded that way or the character of either section. Get the arithmetic right before adding interpretation.
Check the starting time basis in the source. If one value references the starting signal and another the personal start-line crossing, subtracting them directly may mislead. Use the official results legend and event timing information. Do not try to infer the difference between time types afterwards from graph shape.
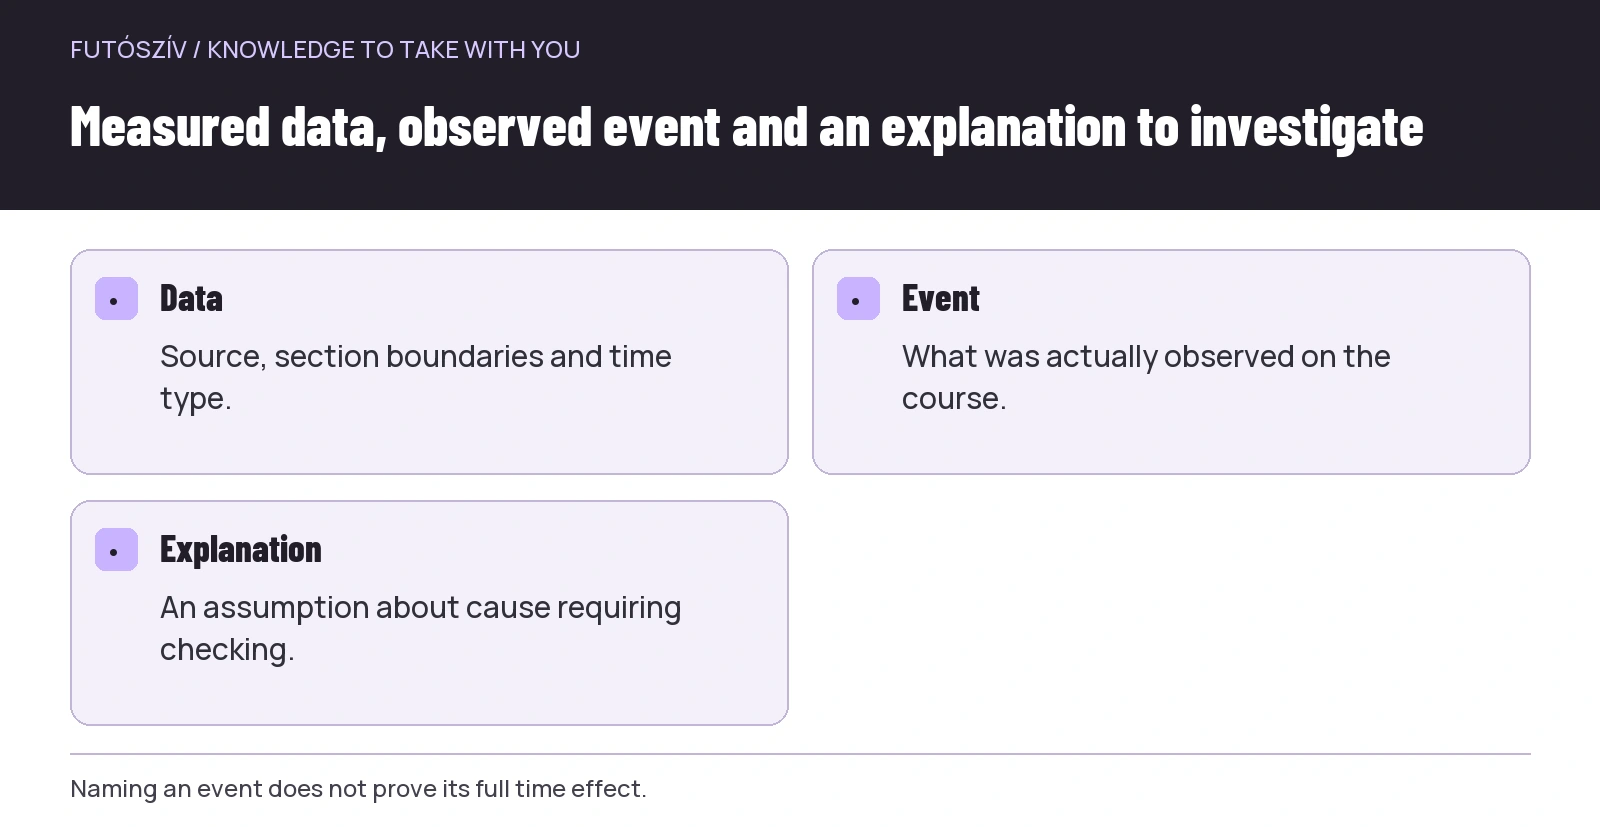 Enlarge diagram
Text version of the illustration
- Data
- Source, section boundaries and time type.
- Event
- What was actually observed on the course.
- Explanation
- An assumption about cause requiring checking.
A watch lap is not necessarily an official race section
Automatically recorded kilometres may follow your device’s distance measurement. Manual laps depend on where and when you pressed the button. First note the lap type in the log. If the boundary did not align with an official sign, preserve that in the review too.
The Garmin Forerunner 265 data-field manual separately treats current-lap and whole-activity averages, for example. Examine field meanings just as carefully on your own device and app. Apparently identical “pace” labels can conceal different periods or operations.
If two sources tell different stories, do not automatically choose the more favourable one. First examine whether the same section is compared. Different starts, lap boundaries or the app’s time concept may explain apparent contradiction without needing an intentionally negative conclusion from either source.
Total elapsed time and moving time are separate questions
Moving time in an activity log may differ from complete race time. Stops, manual pauses or app processing can produce a different value on screen from the event’s results list. Read your system’s explanation and label the time type in the table.
Illustrative example: a ten-kilometre section has 70 minutes of total elapsed time but 67 assigned to movement. The whole event section averages 7:00 minutes/kilometre; using 67 minutes gives 6:42. Both may be meaningful for the right question, but make different statements. You need not erase the difference because one looks better.
If a stop was planned, its duration belongs to actual completion. You can separately examine what happened there to organise next time. The goal is preserving useful information about the stop, not improving the result through a different time concept selected retrospectively.
Are the course sections comparable?
A split difference is not always an execution difference. Sections may vary in length, elevation, number of turns and tasks performed along the way. Calculating average pace matters, but does not remove these conditions. Two equal-length parts can still have very different character.
Include a short course note on the worksheet. You need not reconstruct every street afterwards, only what genuinely relates to the question. You can name a long climb in the second part, for example. Do not claim without measurement that it explains an exact number of seconds.
| Analytical question | Necessary addition |
|---|---|
| Was execution even? | Section character and your original plan |
| Where was there a stop? | Observation or reliable timing data |
| Why do watch and official list differ? | Time basis, distance and lap boundaries |
| What should I change next time? | A specific decision situation and testable task |
Do not construct a certain causal rule from one race
A faster first part may have preceded a slower second. The table alone still does not prove the opening caused everything. Course differences, weather, organisation, your condition or several factors may have contributed. Analysis need not turn every value immediately into a final explanation.
Instead, write a precise hypothesis: the first section was faster than my plan, later execution differed, and I want to discuss this with a coach and further experience. This connects a fact with a next task without claiming more than you know.
The same applies to equipment, new shoes or a fuelling change. One coincidence cannot establish its exact effect. Trying something in future needs an appropriate personal plan. A post-race split table does not replace professional evaluation or healthcare assessment.
 Enlarge diagram
Text version of the illustration
- 5 km: 31:20
- The first point’s cumulative value.
- 10 km: 1:04:50
- The second point’s cumulative value.
- Difference: 33:30
- Time for five kilometres between the points.
Keep observations neutral and usable
Labels such as “I ruined it” or “I had nothing in me” supply little verifiable information. Translate them into actions and situations. For example, at the first official point you had not checked elapsed time, or after the aid station you did not know which route branch came next. These can lead to planned changes.
The Australian Athletics article on coaching reflection also emphasises links between specific observation and the next corrective step. It speaks in a coaching context, but the principle works in personal split analysis too: the more precisely you describe a situation, the clearer what you can later do differently.
Neutral wording does not exclude feelings. You may write that you are disappointed or happy. Simply do not treat emotion as measured data or automatically derive every split’s explanation from it. Feelings and facts can share a worksheet when each has its own place.
Make a small worksheet instead of using the whole graph
Select three or four meaningful sections. For each, record source, boundaries, time type and a brief course note. Then add what you planned and what actually happened. End the table with an open question that available data cannot answer certainly.
This also organises the data. Different distances or times in two screenshots become visible. If you cannot remember where a manual lap was pressed, mark it uncertain. Naming gaps provides a better basis than an invented, flawlessly connected retrospective story.
You need not include every recorded measure. Use only data you understand and that relates to the question. If the main issue was not knowing the aid station’s location, examining another fifteen technical graphs will not solve it.
The next step should not be general punishment
Split analysis should not automatically prescribe more training or a harder next week. The task to improve may be organisational: a simpler watch screen, earlier course review, a clearer timetable or a check at the appropriate point. Plan physical-preparation changes from the whole situation, with professional help if needed.
Choose one specific trial for the next appropriate occasion. You might check manual laps on an easy run, calculate a section time independently from two official intermediate points, or give start-signal and personal-start data separate columns on the next race sheet. These directly address a question found in analysis.
Finally, retain original data and the date of your note. Later, you will see more than an improved memory. What you knew after the race, what you assumed and what further experience established remain traceable. Split analysis becomes useful when it makes the next decision more precise.
Check before sharing the analysis
If sending the sheet to a coach or running companion, add a brief legend beside the screenshot. Identify official checkpoints and personal watch laps. Treat colons in the numerical examples as time separators, not decimal points: 33:30 is thirty-three and a half minutes. Omit personal information unnecessary to the question. The conversation can then begin with an interpretable task rather than requiring the recipient to guess the meaning of an isolated graph.
How Futószív articles are prepared: our editorial guidelines.