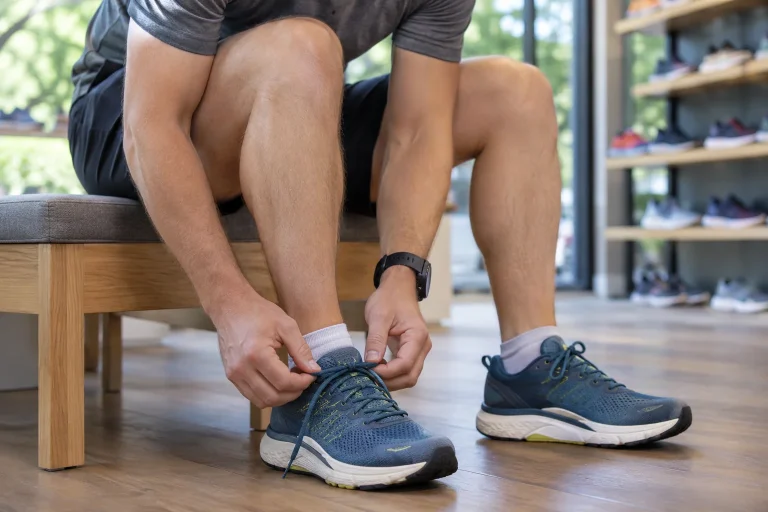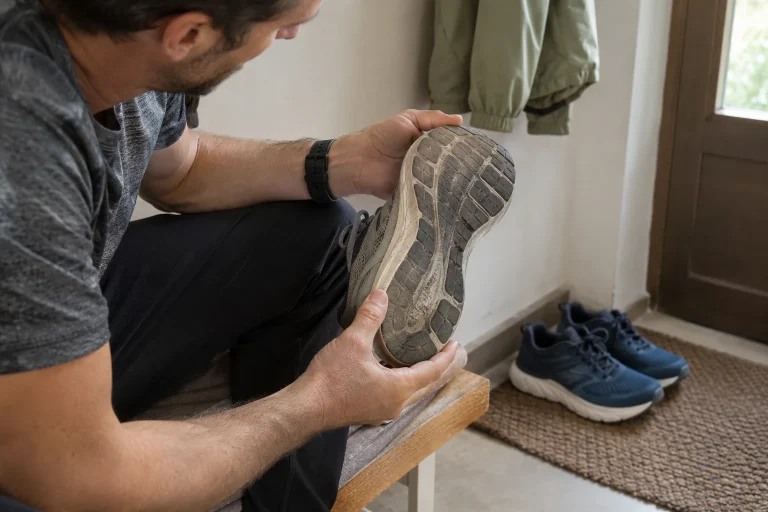
One runner finds a stiffer shoe easier, while another struggles to find rhythm in the same model. Meanwhile, the laboratory group’s average barely changes. These three experiences need not contradict one another. Averages can conceal individual results in different directions, but measurement variation can also contribute to one person’s single trial. Understanding individual response requires retaining both possibilities.
The question is more than whether runners differ. We also need to know how consistent the observed difference is, which particular shoe and speed it concerns and whether it can be identified in advance. An interesting research group does not automatically become a purchasing classification. This guide uses original experiments, our own numerical examples and the logic of a clearly managed comparison to explain differing responses.
What does improvement mean, and in which measurement?
Running-economy studies typically compare physiological cost at a given speed. A lower cost for the same task may mean better economy. This differs from how much a runner likes a shoe or their race time. Comfort, perceived effort, oxygen cost and performance are separate outcomes. Before saying “it helped this runner”, add: in what way?
In a personal situation, a runner might say the roll-through feels more pleasant. This is a real subjective experience worth noting. Without respiratory-gas measurement, it need not become a percentage metabolic saving. The reverse is true too: a more favourable laboratory value does not guarantee a comfortable upper during a long run. Both questions can remain important alongside one another.
Record the sign of change too. If energy demand falls from 200 to 194 arbitrary units, cost decreases by 3 per cent. Another figure might call this a +3 per cent saving. Both can represent the same favourable change. If one graph reports cost difference and another savings, read axis labels before comparing signs.
Four different responses can produce a zero average
In our fictional table, four runners each have a control value of 200 units. In the stiffer shoe, the first has 194, the second 206, the third 198 and the fourth 202. Changes are −3, +3, −1 and +1 per cent respectively. The group average is 200 in both conditions. The average difference is zero, while individual values differ.
| Our example | Control | Other condition | Cost change |
|---|---|---|---|
| Runner A | 200 | 194 | −3% |
| Runner B | 200 | 206 | +3% |
| Runner C | 200 | 198 | −1% |
| Runner D | 200 | 202 | +1% |
This does not establish that A would always improve, B would always worsen or how reproducibly the smaller changes could be measured. The table shows one occasion. Making individual differences visible is an important first step, but differs from proving stable individual responses. Repeatability is the next question.
State two claims separately: “the group average showed no change” and “individual results differed”. Both can be true. A third claim, “this runner definitely belongs to this response group”, needs more information. A personal label says more than a momentary observation and therefore requires more careful checking.
 Enlarge image
The 96-runner experiment and groups formed afterwards
In 96 runners, Chollet and colleagues compared two prototypes differing in forefoot bending stiffness. There was no significant whole-group economy difference. Clusters formed from measured responses and the analyser’s technical error contained 29 people with more favourable results, 26 with less favourable results and 41 essentially unchanged. The magnitude of average change in both favourable and unfavourable groups was approximately 2.7 per cent.
The study brought individual responses out from behind the group average. Clusters were nevertheless formed from outcomes, rather than assigned through a predefined shoe-selection rule already checked in new runners. The favourable group also had higher maximal aerobic speed, but this does not mean one pace threshold can classify every new runner accurately. An observed association and prediction are different tasks.
An everyday analogy for a cluster is grouping similar numbers in a results list. This can reveal a pattern. Predicting the next participant’s outcome before measuring it requires something else: predefined characteristics, a decision rule and testing that rule on new data. Retrospective grouping primarily offers questions and possible explanations.
Why can a small change shift from one category to another?
Neither the measurement system nor a runner’s condition is perfectly constant. Instrument uncertainty, processing and daily fluctuations can add to the difference studied. When the effect between shoes is small, these can more easily change the sign of the observed result. Not every difference is noise, but no single small difference should automatically be called a lasting trait.
In our illustration, shoe A costs 200 units and B costs 198 on day one: B is 1 per cent more favourable. On another occasion, values are 198 and 200: the ranking reverses. Those two rows cannot establish how much was a true shoe effect and how much reflected differences between occasions. Repetition matters because it shows stability in the direction and magnitude of the result.
A methodological paper by researchers in the field specifically highlighted problems with individual labels based on one-off economy measurements and proposed repeated measurements on the same day. This is a methodological recommendation, rather than a new personal error percentage applying to everyone. Consider the particular laboratory procedure, instrument and observed variability.
Rounding percentages can hide detail too. A displayed “1% improvement” may rest on different calculation bases and precision. Retain original values, comparison direction and repetitions. More decimal places alone do not resolve uncertainty, but traceable calculations allow conclusions proportionate to measurement.
A shoe effect is tied to the speed studied too
In 28 male runners, Rodrigo-Carranza and colleagues examined increased bending stiffness at two performance levels. Economy results differed by group and speed, while the 3000-metre time trial showed an advantage in a similar direction in both groups. The short physiological measurement and actual running performance therefore did not represent exactly the same comparison.
When interpreting your own trial, do not silently switch the task. An easy run in one shoe and faster intervals in the other do not provide a clean shoe test. Matching external speed and similar surroundings makes reasoning about differences easier. If the aim is comfort at race pace, name that task separately too.
Familiarisation and trial order may matter as well. If new shoes always come at the end of a run, fatigue or warming up can enter the comparison. Research procedures may therefore manage order and rest. Simply wearing two shoes does not turn your diary into a controlled experiment, but recording order and conditions helps interpret experience more meaningfully.
Choosing by comfort is not a flawed physiological decision
In Bolliger and colleagues’ 2026 crossover study, fourteen runners repeated the protocol in three shoe types, at four speeds and on three separate days. Oxygen cost and comfort were reported as separate outcomes. In comparisons of the most and least preferred models, comfort was meaningfully associated with preference too. Shoe choice was therefore described by more than a single physiological number.
This is a reassuringly precise distinction for runners: you can choose something because it fits well and feels pleasant for a task without claiming it is a measured metabolic winner. Describe comfort specifically, however. Heel hold, forefoot space, upper, roll-through, perceived weight or underfoot feel? Details help later explain why you liked it and how experience changed with longer use.
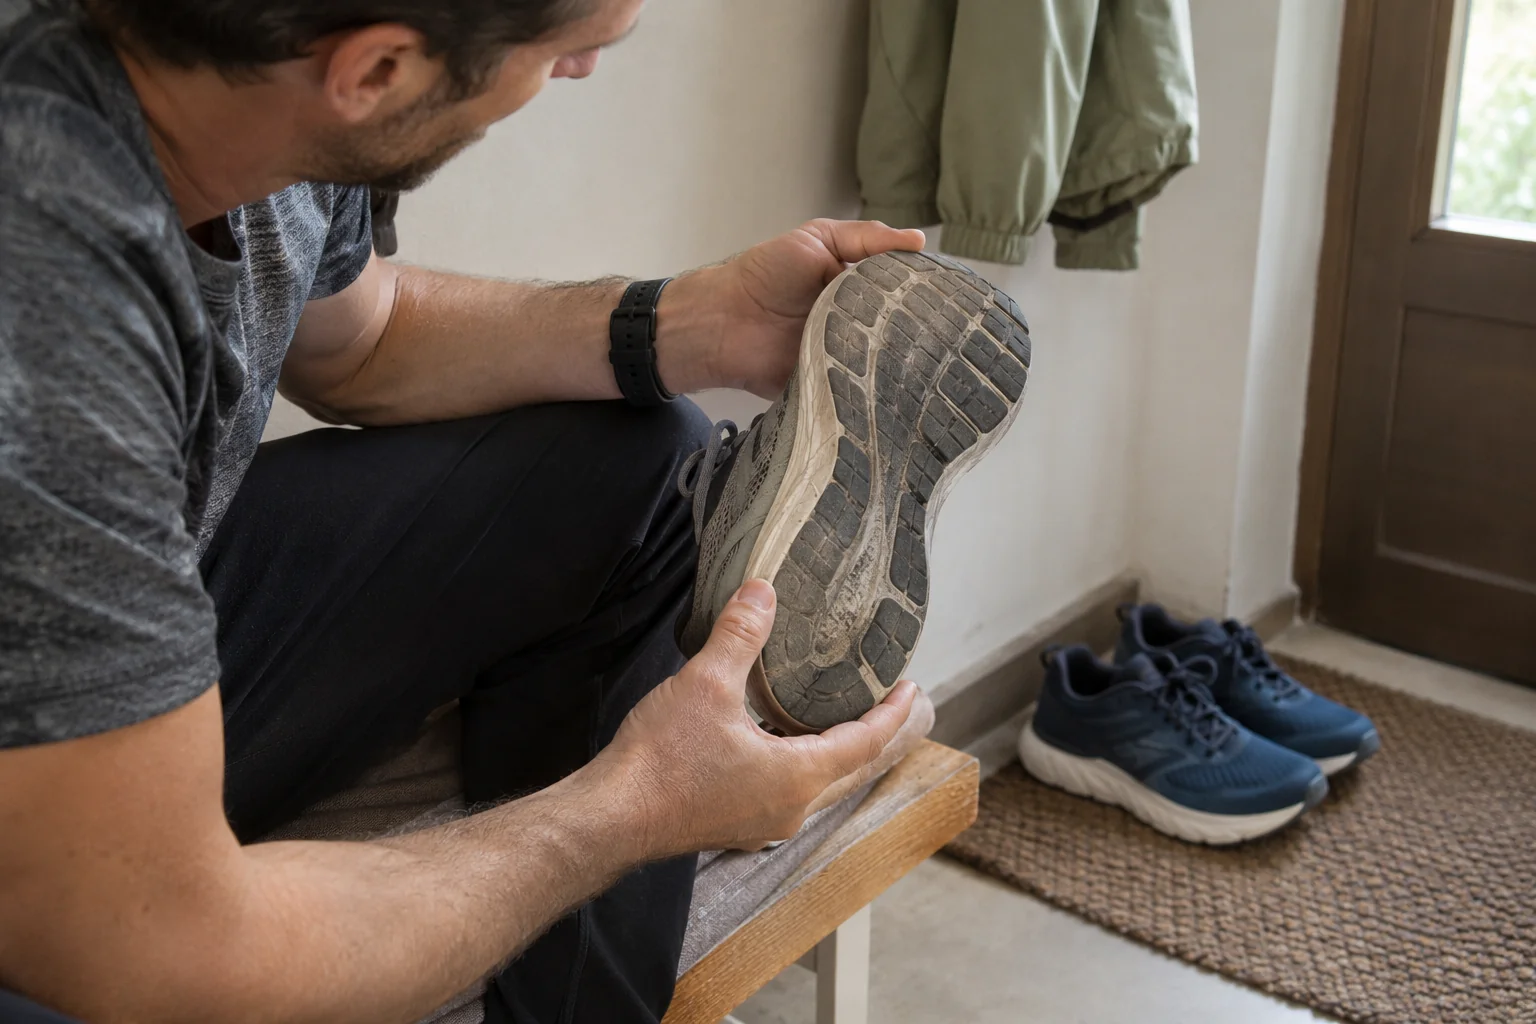
Discomfort does not automatically establish poor economy, but matters independently to use decisions. A research average need not make you ignore a pressing upper or uncertain fit. The aim is to know which information answers which question, rather than fit your own experience to one graph.
 Enlarge image
Keep a comparison you can learn from later
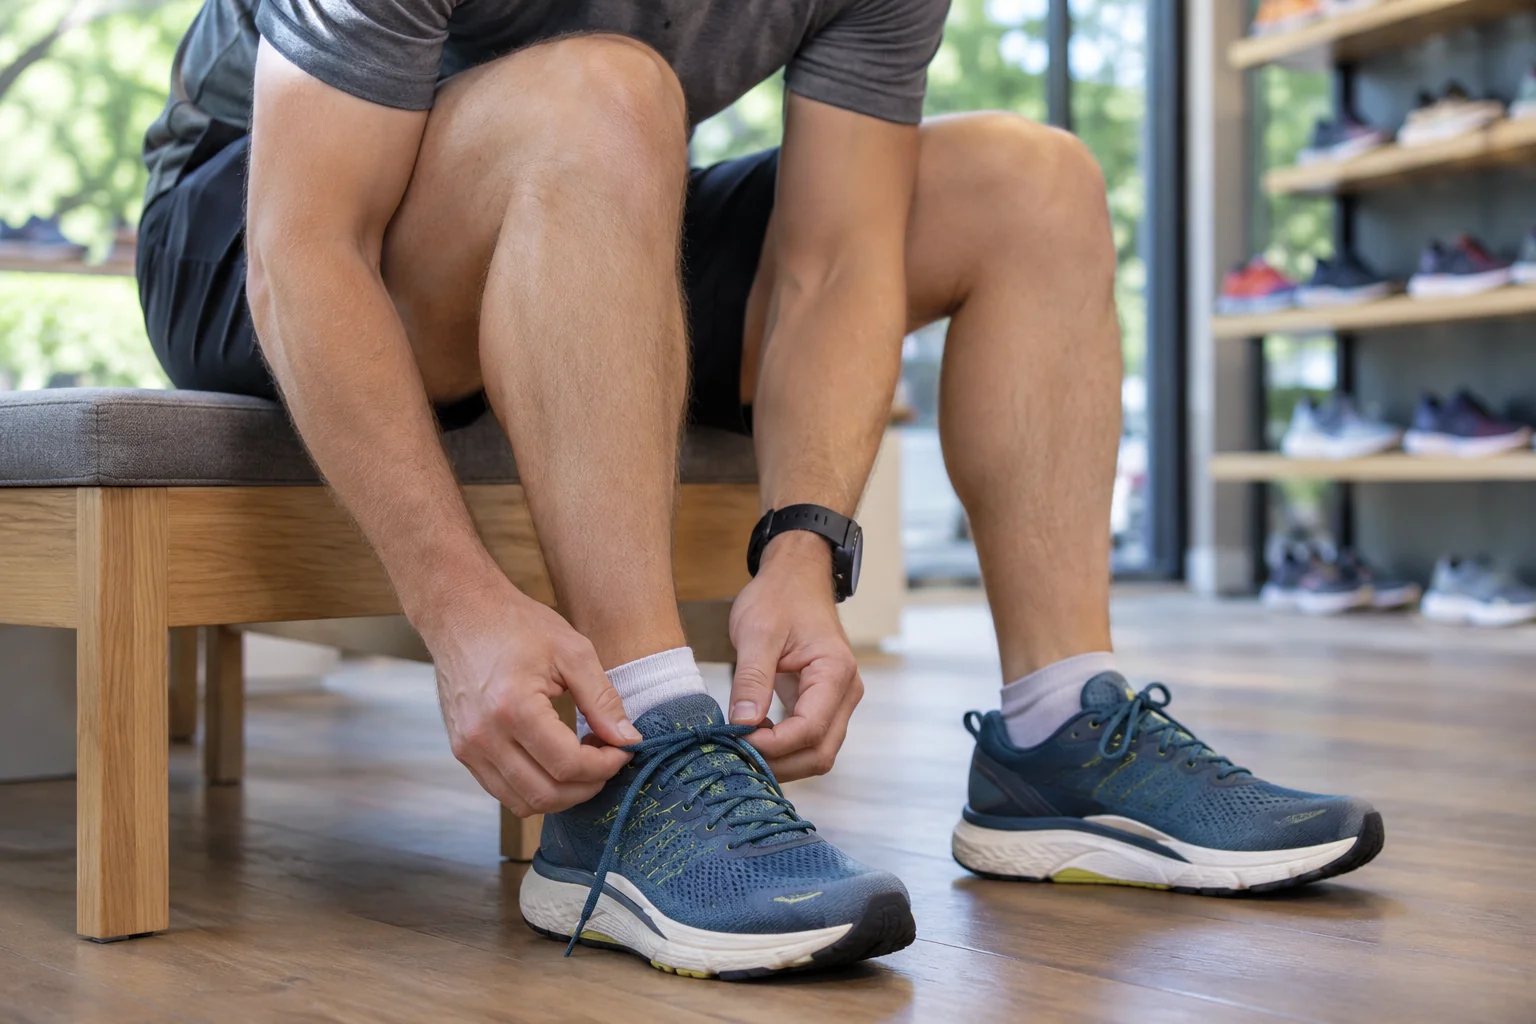
First choose a question: which shoe is more comfortable for easy running, which suits faster work or whether a laboratory can measure an economy difference? These need different records. Describe personal sensations consistently and retain instrument results alongside measurement methods. Do not silently mix the two sources.
- Task: distance or time, pace, surface and purpose.
- Circumstances: weather, order and a short description of preceding activity.
- Shoe: exact model, size and prior use.
- Experience: specific comfort characteristics and perceived effort separately.
- Repetition: did the result remain in the next similar situation?
A different second result is not failure. It adds information about uncertainty or dependence on circumstances. One shoe may feel better for short fast running, another for longer easy work. You need not force every model into one permanent ranking. Differences by intended use often help more in everyday life.
Make conclusions from your own data only as strong as the notes support: “On two similar easy runs, the forefoot felt more comfortable.” This is more precise than a lasting biological type label. For instrumented laboratory findings, ask about repetition and measurement uncertainty. Studying individual response then becomes both more personal and more reliable.
Individual difference is a question, rather than an instant label
A group average is important scientific information, but not a complete description of every personal decision. Individual values reveal variation, repeated comparison helps identify stable patterns and separate outcomes preserve distinct meanings of comfort and performance. No level needs to replace another.
Next time you read that the same stiffer shoe helped someone and hindered another, ask: in which measurement, under which circumstances and how repeatably? These questions preserve your own experience without overstating research. Good shoe selection is not finding the name of a retrospective cluster, but connecting purpose, fit and appropriately interpreted evidence.
Sources
- Chollet and colleagues: individual responses of 96 runners to changing bending stiffness.
- Barrons and colleagues: methodological paper on the need for repeated economy measurements.
- Rodrigo-Carranza and colleagues: speed, training-status group and bending stiffness.
- Bolliger and colleagues: repeated shoe comparisons at slower speeds.
How Futószív articles are prepared: our editorial guidelines.