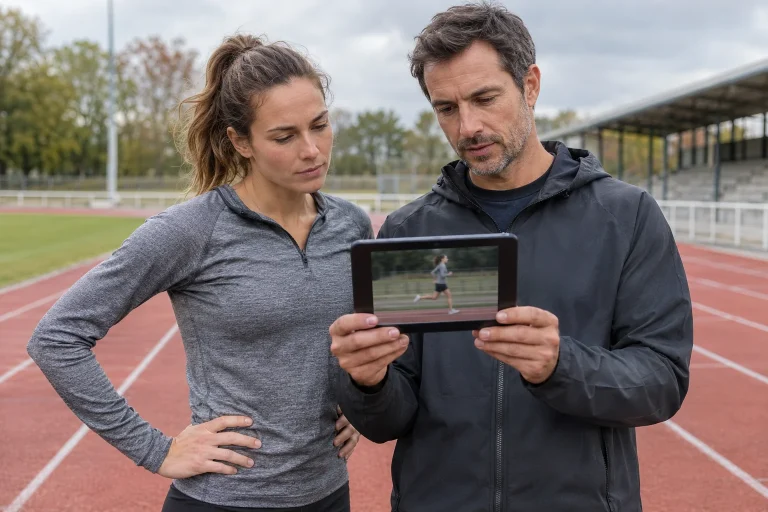
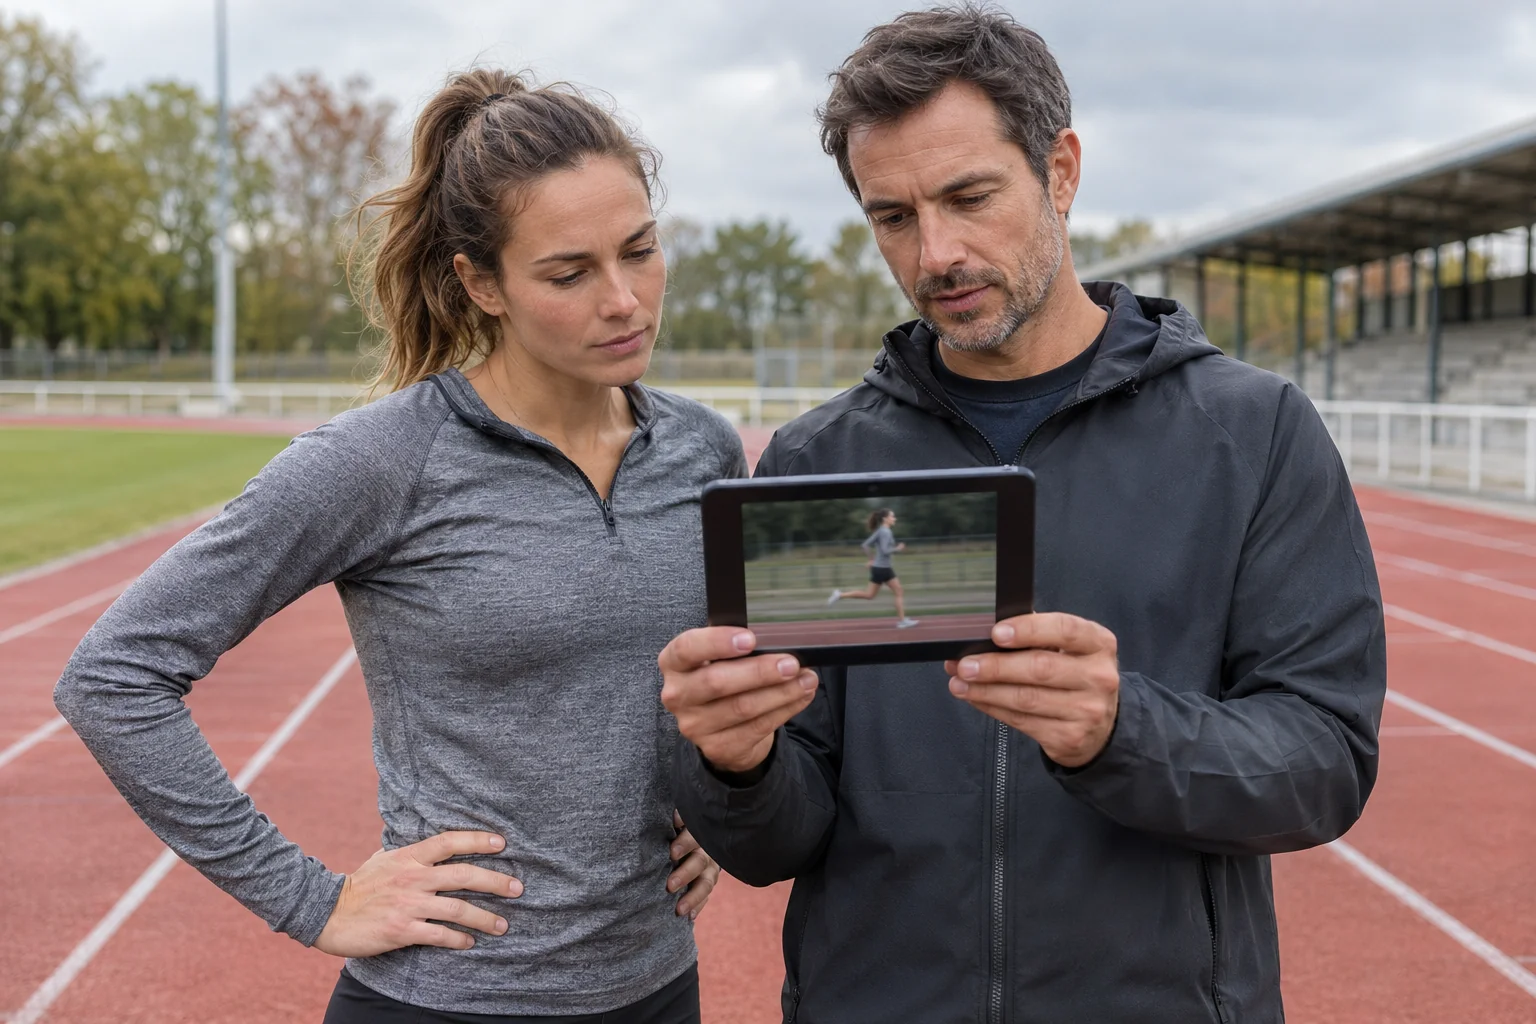
Running-video analysis often begins by pausing the recording, marking three points on the leg and reading an angle displayed by the app. A decimal place can easily create the impression of a precise measurement. Yet four questions need answering first: which angle have we defined, at which point in the movement did we measure it, what could the camera see, and how consistently did we select the points? The number can be interpreted only alongside those details.
Side-view footage can be particularly useful for observing timing, successive movements and certain angles within a plane. You do not need to abandon it because it is not a full movement laboratory. Good analysis, however, does not confuse knee flexion with the foot’s position relative to the ground, or assume equal accuracy for every variable. This guide helps you frame the measurement question: what should you name, be able to retrieve and check before an angle becomes a training decision?
Start by naming the exact angle you are interested in
Knee flexion, forward shank inclination and the foot’s angle relative to the ground are three different quantities. In a schematic side view, knee flexion describes the relative positions of the thigh and shank. Shank inclination, however, needs an external reference such as vertical. The foot angle follows another line again: it might describe the relationship between the shoe’s visible longitudinal axis and the ground line. These different terms involve different landmark selections and different zero positions.
Imagine a completely straight leg. At the three selected points, one program shows 180 degrees, while another reports 0 degrees of flexion relative to full extension. If the first later shows 150 degrees, the second definition may describe 30 degrees of flexion. These are not two different movements or a measurement error of 120 degrees. The difference lies in the angle convention. When comparing screenshots, therefore, knowing what counts as zero and which direction is positive matters even more than the program’s name.
Describe the measured quantity in one sentence: ‘I am looking at knee flexion in the nearer leg during stance after initial contact, taking full extension as zero.’ That is a task you can check afterwards. ‘I am checking whether my knee is good’, however, combines several questions: position, load, pain and performance. A measurement becomes more useful as its question becomes narrower and clearer.
What did a study of automated side-view measurement show?
In the original study by Peebles and colleagues, twenty uninjured participants were recorded running on a treadmill simultaneously with a two-dimensional camera and a three-dimensional system. Both recorded data at 120 Hz. Agreement between methods varied by variable: it was rated excellent for foot angle at initial contact and knee-flexion range of motion, good for ankle and knee angles at initial contact, and moderate for maximum knee flexion. Differences between the methods also remained and varied between participants.
The practical lesson concerns the precision of the question. A system’s promising result for one variable does not imply the same result for maximum knee flexion or another program’s landmark recognition. When comparing two methods, always look for the specific outcome: was it the value at initial contact, range of motion or a time-series curve? ‘Running video was validated’ is too broad a summary to guide you.
The study used automated marker tracking; this is not equivalent to the operation of any phone app. Manually selected external landmarks, joint centres estimated by a recognition algorithm and angles calculated from a three-dimensional model also follow different processing pathways. If you switch tools, treat the result as a new measurement series rather than a simple continuation of the previous decimal places.
 Enlarge image
Good camera placement is part of the measurement
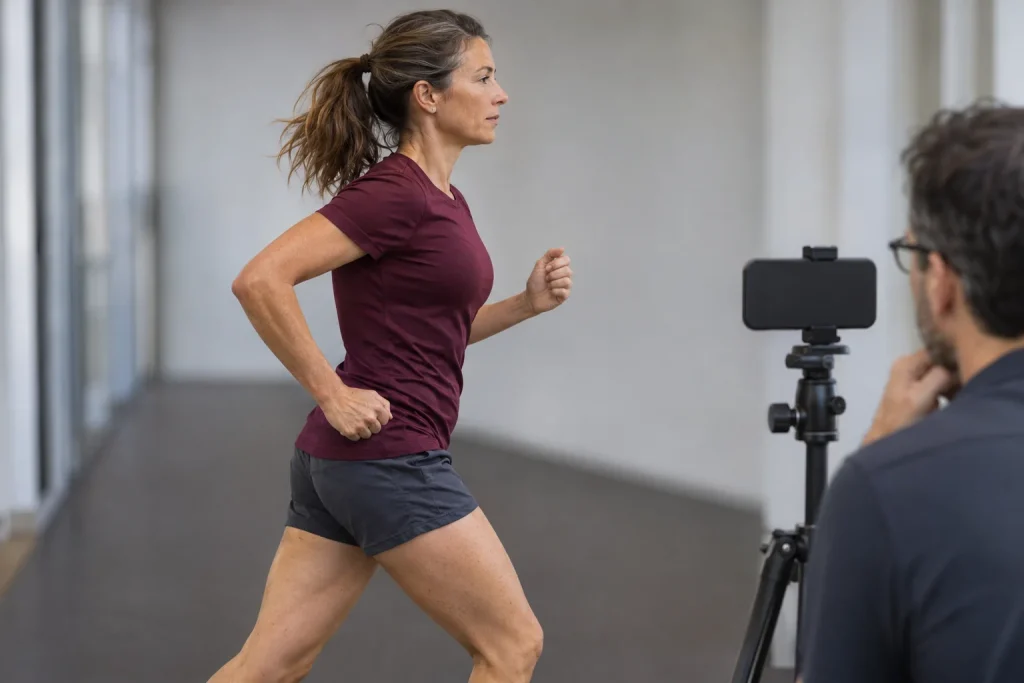
For a side view, aim for a view as perpendicular as possible to the main plane of forward running. Do not chase the runner with a handheld phone if you later want to compare differences of a few degrees. A fixed tripod and predefined observation area make it easier to distinguish a change in movement from a change in camera angle. The full visible range of motion should fit within the frame: you cannot reliably select an event later if contact with the ground was cropped out.
An ideal view does not mean that every video has one compulsory tripod height in centimetres. Locations, fields of view and the body part being examined differ. You need a setup that does not show the important points at a steep angle from above or below, and that you can reproduce for another recording. Record the camera height, the runner’s path and the device position just as you record pace.
The nearer and farther legs may not be equally visible. A shorts hem, the other leg, an arm or a shadow can obscure a landmark. Temporary loss of a point can cause a sudden jump in the curve, especially with automated tracking. If the knee position jumps unrealistically between consecutive frames, check the recording and tracking before judging the runner’s movement.
Compare the same instant: initial contact, peak or full interval
A knee angle measured at initial contact should be compared only with a value measured at the same event. Several frames and a noticeable angle change may separate the first visible shoe–ground contact from a lower position when the body is already bearing weight. If you pause one video earlier and another later, you can find a difference without any real technique change. Define the event you are looking for in advance and select it consistently.
To find maximum knee flexion, one visually striking, preselected image is not enough. You need to examine the relevant stance phase throughout. Even in two consecutive steps, the peak does not necessarily occur at the same frame number. Range of motion requires the difference between at least two well-defined positions. A ‘peak’, a ‘value at initial contact’ and an ‘excursion’ are therefore three different processing tasks.
An original illustrative example: one step shows 18 degrees of knee flexion at initial contact and a later maximum of 44 degrees; another moves from 22 to 46 degrees. The second peak is larger, yet its change from initial contact is smaller: 24 degrees compared with 26 in the first. These are invented numbers illustrating the definitions. A single label reading ‘knee angle’ would hide both important differences.
Temporal resolution: how much can happen between two frames?
Frame rate determines the time interval. Thirty frames per second mean approximately 33.3 milliseconds between images, while 120 frames mean 8.3 milliseconds. This is simple division: divide one second by the number of images. Higher sampling shows the timing of rapid events in finer detail, but does not itself improve the camera’s view or reveal an obscured anatomical landmark.
Suppose, purely as a worked example, that an observed angle changes by 100 degrees per second over a short interval. If we imagine an approximately uniform change during that interval, about 3.3 degrees could occur between two frames of a 30-frame-per-second video, compared with 0.83 degrees at 120 frames per second. Real running movement is not this uniform, so these figures do not become general measurement-error limits. The example shows why the point at which you pause matters.
Slow-motion playback and a genuinely high frame rate are not the same thing either. Slowing a recording originally sampled at a low rate leaves you looking at the same images for longer; it does not measure the missing real instants. An intermediate image generated by software is a calculated result. When locating an event, retain the original recording settings and export method too.
A repeatable number, an accurate number and a useful change
Repeatability asks whether we obtain a similar result again using the same procedure. Validity here concerns how closely the number agrees with the appropriate reference method. A landmark consistently placed in the wrong position can yield a very similar angle every time. This can be an offset that persists despite good repeatability. Conversely, a method that performs well on average may show considerable variation in repeated landmark selections on an uncertain frame.
An original, non-research example: for a position a model describes as 30 degrees, a video procedure gives 35, 35 and 36 degrees in three measurements. The numbers cluster closely but remain several degrees away from the chosen reference. Another series might give 27, 30 and 33 degrees: its average is 30, but individual measurements vary. Average agreement therefore cannot promise the same accuracy for every image.
Neal and colleagues, studying runners with patellofemoral pain, compared a phone-based two-dimensional procedure with three-dimensional measurement. They found poor validity for the hip-adduction and knee-flexion variables examined, while some repeatability measures were more favourable. This illustrates particularly well why one measurement property does not replace another; it is not a general judgement on every phone method and every angle.
 Enlarge image
What does the person do, and what does the algorithm do?
In manual analysis, the person chooses the event and landmarks. In automated analysis, software takes over some decisions, but that does not make the method free of assumptions. Body parts close together, loose clothing, blur and occlusion may require separate checking. Examine at least a few frames to see whether the marked knee or ankle really is where the analysis says it should be.
In the original multi-camera OpenCap system, further results are derived through landmarks estimated from phone images, three-dimensional reconstruction and movement simulations. That is a different task from measuring the angle between two straight lines on a side-view photograph. A phone can provide input to both, but the number of cameras, calibration and computational model change the result obtained. The outward similarity of the device does not make the methods identical.
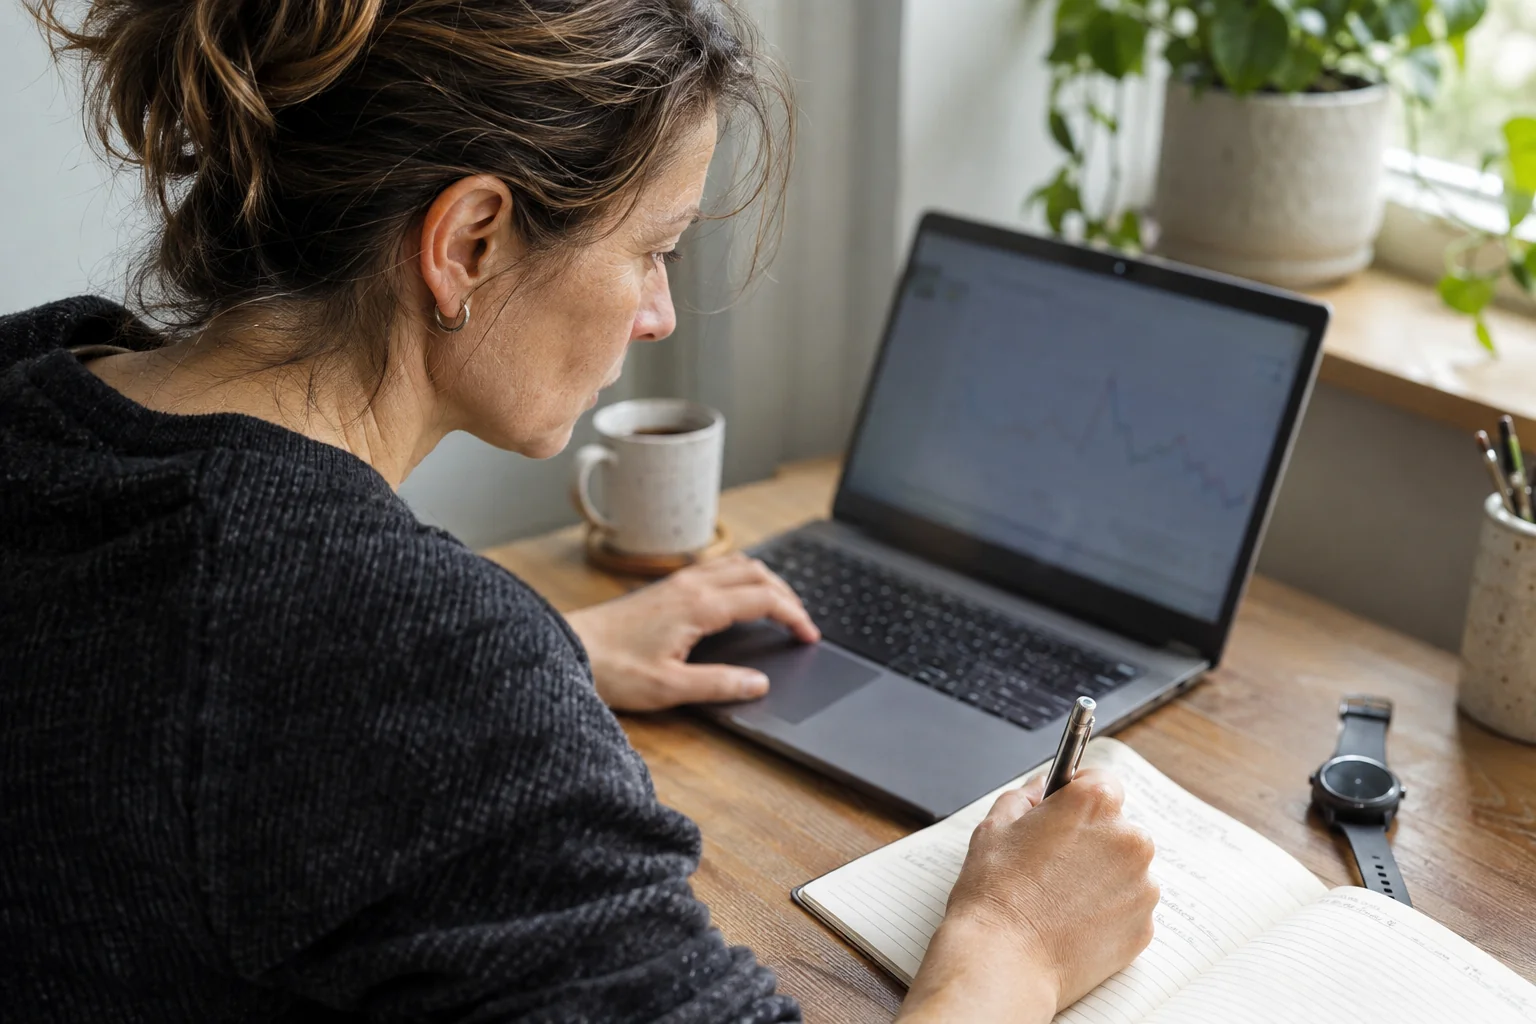
You can therefore record the processing in a short measurement log: original video file, selected side, event examined, landmark-selection rule, software and version, and steps checked. If someone later measures a different number, you will have something to refer back to. The difference then becomes something you can clarify in the definition or processing, rather than a personal dispute over who sees the movement better.
How to make a useful results sheet
A results sheet for your own observation can be brief yet precise. Do not keep only the best-looking image: retain several consecutive steps with adequate visibility. Record the original speed, surface, shoes and whether filming took place near the beginning or end of the run. An angle difference found at a changed pace answers a different question from a repeated observation under the same conditions.
- Variable: exact name, zero position and unit.
- Event: which leg, which movement phase and which selection rule.
- Recording: camera placement, original frame rate and visibility.
- Result: values from several steps, rather than a single highlighted decimal place.
- Next question: what would you like this to help you understand about your training?
Your final wording might be: ‘With the same recording setup, I measured less knee flexion at initial contact over these few steps; the peak changed very little.’ That is far more informative than ‘My running technique improved’. Interpreting pain, injury or deteriorating performance requires further history and appropriate assessment. Used well, video contributes a precise observation: it shows what was visible, when it was visible and how the number was produced.
Sources
- Peebles and colleagues: validation of automated side-view running kinematics.
- Neal and colleagues: comparison of phone-based 2D and 3D running measurements.
- Uhlrich and colleagues: OpenCap, multi-camera movement estimation.
How Futószív articles are prepared: our editorial guidelines.