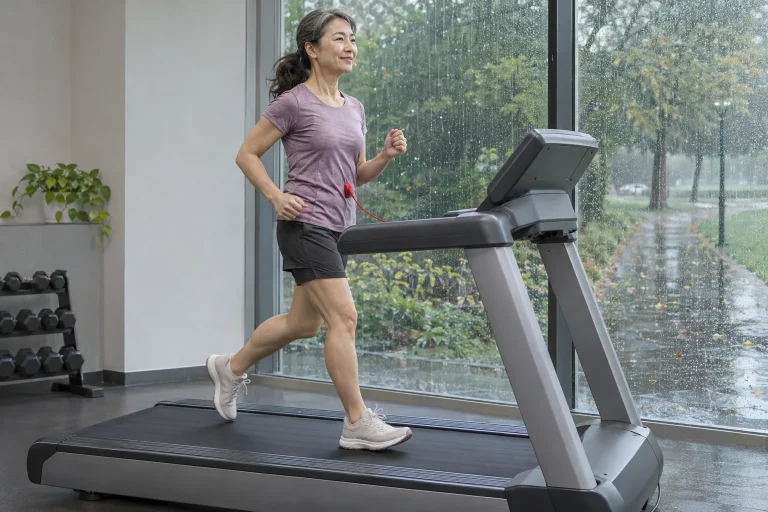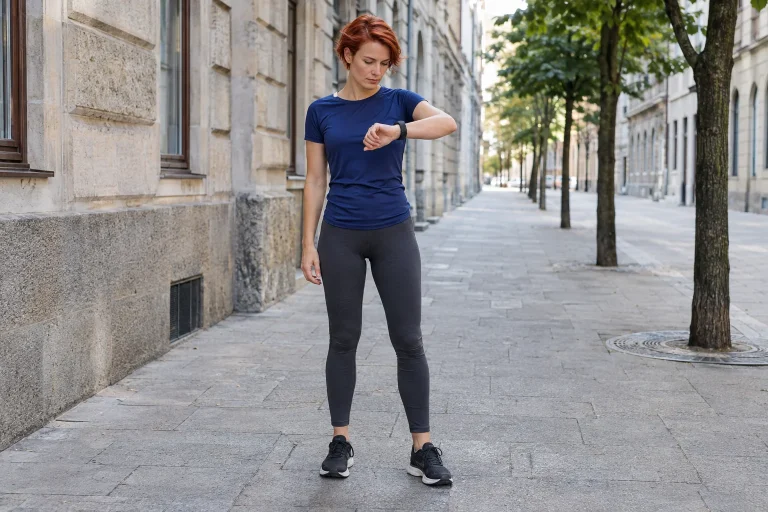
When thinking about feeling good after a run, we often imagine one rising curve: you move, an enjoyment-related substance increases and your mood improves. Endocannabinoid research reveals a more interesting picture. Even which compound we discuss matters. Anandamide and 2-AG are separate molecules, and their measured blood changes need not appear at the same time or in the same way. Diverging curves are therefore not an incidental complication, but information about how the body responds to different exercise situations.
Two abbreviations represent two distinct signalling substances
Papers often abbreviate anandamide as AEA; 2-AG is short for 2-arachidonoylglycerol. Both relate to the body’s own endocannabinoid signalling system. Belonging to a shared system does not make them two names for one substance or their measurements interchangeable. If research news describes ‘increased endocannabinoids’, check exactly which compounds were measured. AEA and 2-AG may have separate results behind that collective word.
Think of two traffic-monitoring points in a city. Both inform us about traffic, but we do not expect identical curves every minute. This is not a biochemical explanation, but an interpretive aid: naming a broad system does not make all its measured elements identical. Different time courses do not automatically make one signal incorrect or less important. First understand which substance changed, under which circumstances and when.
Endocannabinoid here refers to the body’s own molecules. Running-study findings do not imply advice to use an external substance. The papers compare concentrations determined from blood samples within a particular exercise situation. This is a more precise, narrower claim than ‘running does the same thing as something else’. Such an analogy can obscure differences in substance, site of action or measurement method.
A cycling study already showed different responses
In their 2012 human study, Heyman and colleagues analysed blood samples from eleven healthy, trained male cyclists during exercise and brief recovery. AEA concentration rose, while 2-AG did not change significantly during the period examined. Other signalling substances were studied too; here, the different behaviour of the two endocannabinoids matters. The shared exercise situation did not produce identical responses in every measured molecule. This provides specific human data showing why describing the entire system as one general ‘pleasure-molecule level’ is inaccurate.
Do not translate this as one compound working and the other not. Detecting change and understanding a signalling system’s role are different questions. If a concentration shows no convincing baseline difference in one measurement, that does not establish the molecule’s uselessness in every situation. Researchers examined these participants at particular sampling times. Understanding the conclusion requires retaining that framework.
The cycling setting provides an interesting comparison for runners, but cannot be transferred unchanged to every run. Related activities do not thereby have identical loads, participants or designs. This study makes the initial assumption more precise: read AEA and 2-AG responses separately. It cannot tell you the quantities circulating in your own blood after Tuesday’s loop.
 Enlarge image
What did a timeline following a long run add?
One part of Siebers and colleagues’ 2026 field study examined marathons and duration-matched walks among 19 trained runners. Blood was sampled repeatedly during running and again 45 minutes after finishing. AEA rose gradually during the marathon and remained elevated at the end of recovery; the 2-AG rise became more pronounced later, during the run’s final part and early recovery. Another part of the paper also found post-run differences among ultrarunners. The new perspective here is the molecules’ separate time courses, with the post-exercise period included in comparison.
A straight line between start and finish would not tell this story fully. Repeated samples can show whether the signals change earlier or later relative to each other. ‘After running’ therefore does not identify a single time: it can mean immediately after stopping or a later sample. Comparisons between articles measuring at different times require that information. Otherwise, early and late details are treated as pictures of the same moment.
This lesson does not establish when your ‘best’ running experience arrives. Measured blood time courses and personal feelings do not follow a compulsory timetable synchronised to one clock. A signalling-substance curve is a scientific result, while experience can be examined through personal reports. Their relationship requires separate analysis. A concentration changing later cannot identify the minute every runner becomes calm or joyful.
Why can two snapshots and a fuller curve tell different stories?
Imagine an illustrative example, rather than real research data. You measure two signalling substances only before starting and at the activity’s end. Both exceed baseline. Additional intermediate points might reveal that one changed early and the other near the finish. A two-point account is not necessarily wrong; it shows less detail. ‘Both increased’ and ‘they followed different time courses’ therefore need not contradict each other.
The reverse is possible too. A substance changes temporarily during an activity, then returns near baseline by the end. Measuring only beginning and end would miss the intermediate difference. This is a general temporal sampling issue, rather than the proven universal behaviour of either endocannabinoid. It illustrates what to inspect on the horizontal axis: actual measurement points, or the visual continuity of a connecting line that we may overinterpret?
A line connecting points does not mean values were measured every intervening second. Nor need we invent a story about an unsampled period. A good figure shows time points alongside study circumstances. Looking at points before the curve is useful: when were samples actually taken, how many data points support the drawing and what claim do the authors use it for? This clarifies the molecules’ differing descriptions without artificially expecting identical curves.
Same height, same change, same meaning?
In another illustration, one substance begins at a lower value than the other. Equal changes on their own scales may still yield different relative changes. With two separate vertical axes, similarly rising lines do not establish equal change magnitudes either. Absolute values, differences from baseline and percentages highlight different questions. You need not recalculate them mentally, but recognising which the paper displays helps.
Do not compare the two AEA and 2-AG result series as though ranking two race competitors. A higher concentration alone does not make a molecule more important, a reward greater or a workout better. ‘Which increased more?’ first requires clarifying relative to what, in which units and at what time. Understanding biological roles also differs from ranking blood quantities. One graph cannot replace the entire signalling process.
| Detail to find in the figure | What does it clarify? | What does it not establish alone? |
|---|---|---|
| Molecule name | Whether the result concerns AEA, 2-AG or several outcomes. | It does not define the entire running experience. |
| Horizontal axis | When samples were taken relative to exercise. | It does not show unmeasured intermediate moments. |
| Vertical axis | Whether concentration or change from baseline is displayed. | It is not a shared pleasure scale for both molecules. |
Exercise conditions and time of day also belong in the story
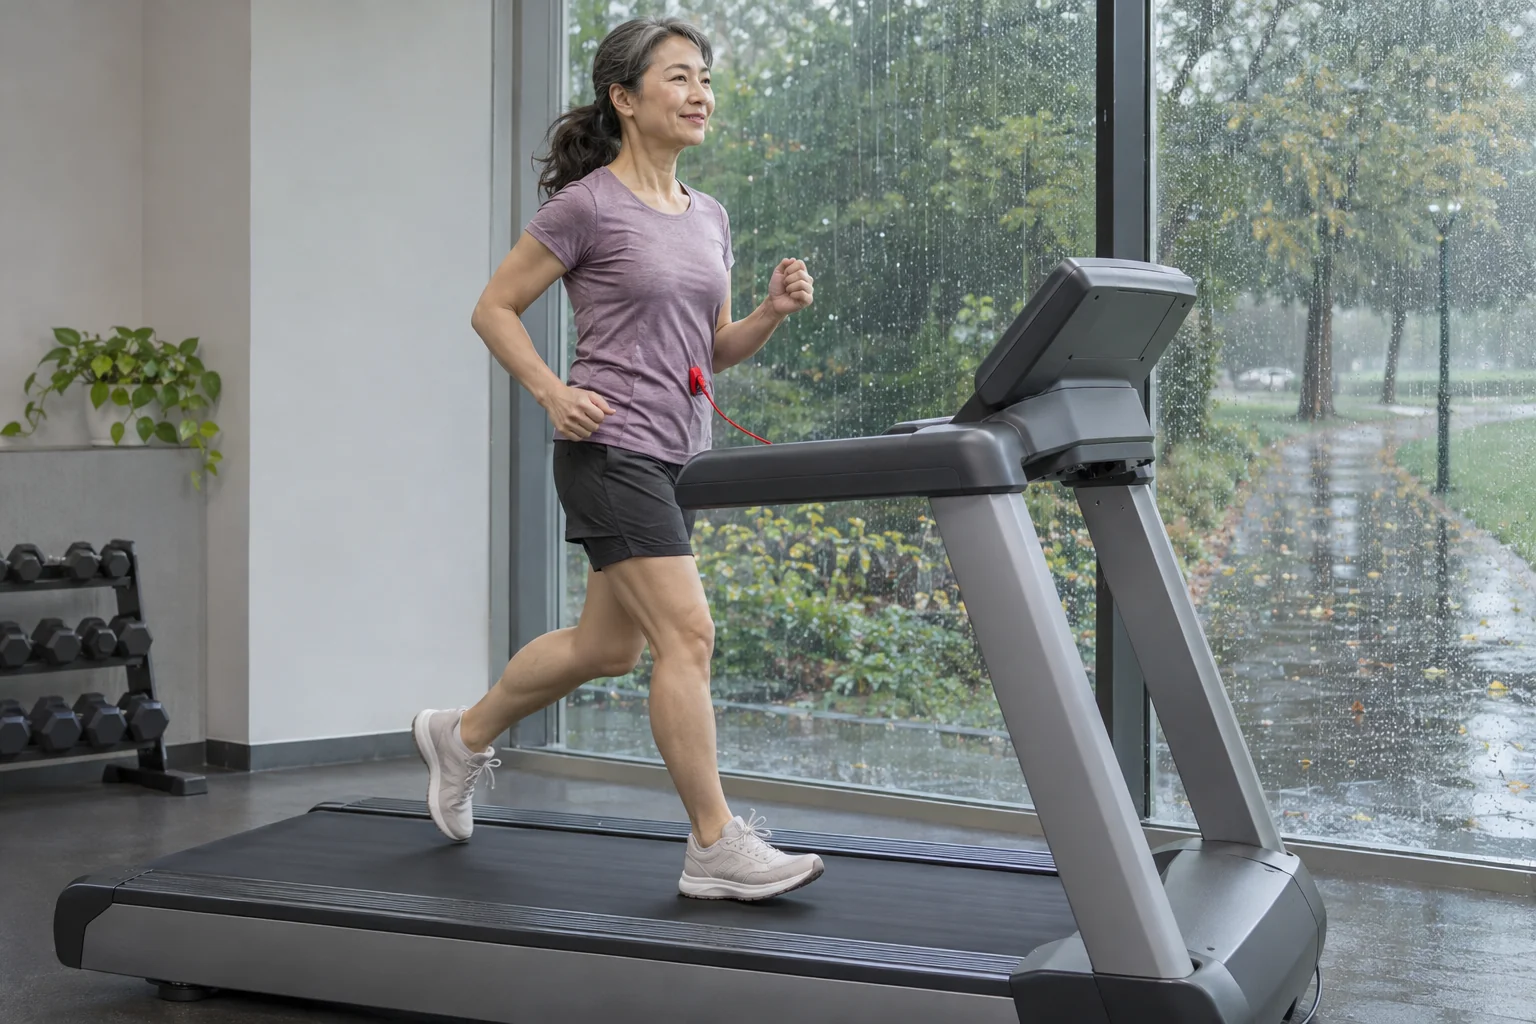
Raichlen and colleagues examined circulating endocannabinoids after treadmill exercise at different intensities among recreationally trained runners. An important message is that intensity must be considered in interpreting results. Curves from different situations may therefore differ for reasons beyond measuring different substances. Examine the conditions of the exercise being compared too. Detailed intensity findings are a separate topic; here, ‘measured after exercise’ alone is not a complete study setting.
Another human study tracked 2-AG’s daily course through repeated blood sampling. Hanlon and colleagues’ controlled-condition study found a time-of-day rhythm. It was not a running study and provides no universal personal timetable for every AEA and 2-AG change. It does highlight timing as a background condition in its own right. If samples are collected at different times of day, not every difference can automatically be attributed exclusively to the run between them.
Separate two timelines when reading. One is relative to the activity: before, during and after. The other is clock time: morning or afternoon. Confusing them resembles treating a running split and wall clock as one axis. Study design can help distinguish these effects; look for how comparison sessions were arranged. This still does not imply you must train at one ‘molecularly ideal’ time.
 Enlarge image
A blood-measured molecule is not a personal pleasure meter
A laboratory result describes the concentration determined from a particular sample. Experienced calm, euphoria and effort are other data types. Changing together is an interesting relationship; failing to do so is also a result requiring interpretation. ‘Why wasn’t I happy if a substance rose?’ already assumes a direct correspondence needing separate proof. Running experience is not another name for a laboratory report, and a molecule does not score your satisfaction.
Words describing experience therefore help personal observation more than presumed chemical labels. You can say you became calm, had company, found the effort difficult or simply enjoyed moving. These are not inferior information because they do not come from blood sampling. They answer another question. Studies collecting experiential reports do so precisely because molecular data alone do not describe participants’ feelings.
The best lesson from two separate curves is therefore a richer picture, rather than a new running trick. Separately tracked AEA and 2-AG responses show why exercise’s chemical accompaniments deserve examination across timelines and measurement types. You need not ‘maximise’ either molecule or adapt experience to published figures. Your run’s value still comes from that day’s actual experience. Research adds explanatory detail, rather than a compulsory emotional timetable.
Sources
- Raichlen and colleagues: Exercise-induced endocannabinoid signaling
- Siebers and colleagues, 2026: Endocannabinoid dynamics across marathon and ultramarathon running
- Heyman and colleagues: Intense exercise increases circulating endocannabinoid and BDNF levels
- Hanlon and colleagues: Circadian rhythm of circulating 2-AG
How Futószív articles are prepared: our editorial guidelines.