An overnight low point is data first, not a diagnosis
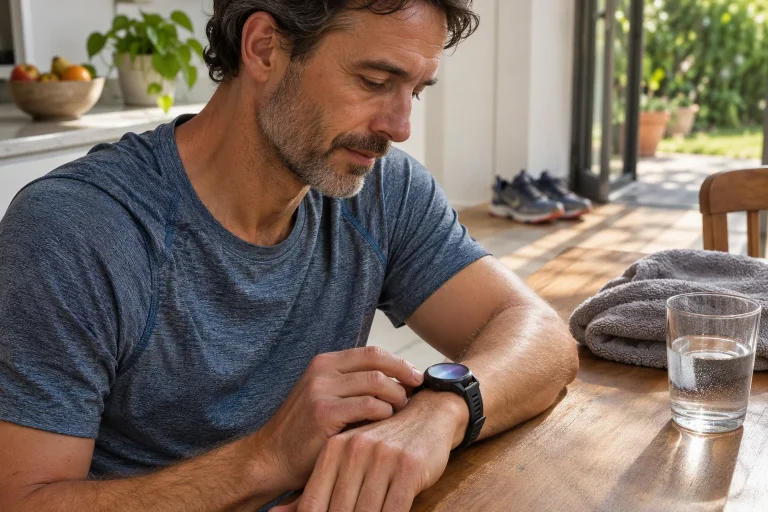
You open the running watch’s sleep data in the morning and see one strikingly low oxygen-saturation point. The graph can look more serious than the recording reliably establishes. The first step is neither ignoring the number nor diagnosing a disease yourself. Know which device, measurement mode, signal quality and temporal summary it represents.
According to the FDA, a pulse oximeter uses light to estimate blood oxygen saturation and heart rate, often with a finger-mounted device. The estimate is not flawless under every condition. The regulator also stresses considering symptoms and how you feel rather than relying solely on the displayed number. Source: FDA, pulse oximeters. Additionally, interpret a specific wrist sports-watch feature according to its manufacturer’s intended purpose.
This article helps turn the graph into a useful question: is there a recurring interpretable pattern, uncertain measurement or a symptom needing separate assessment? It gives no home diagnostic threshold applicable to every device. Oxygen-saturation percentage is not a running-performance score, and one low indication alone does not settle the next workout or a sleep-disorder question.
Wrist and finger are different measurement situations
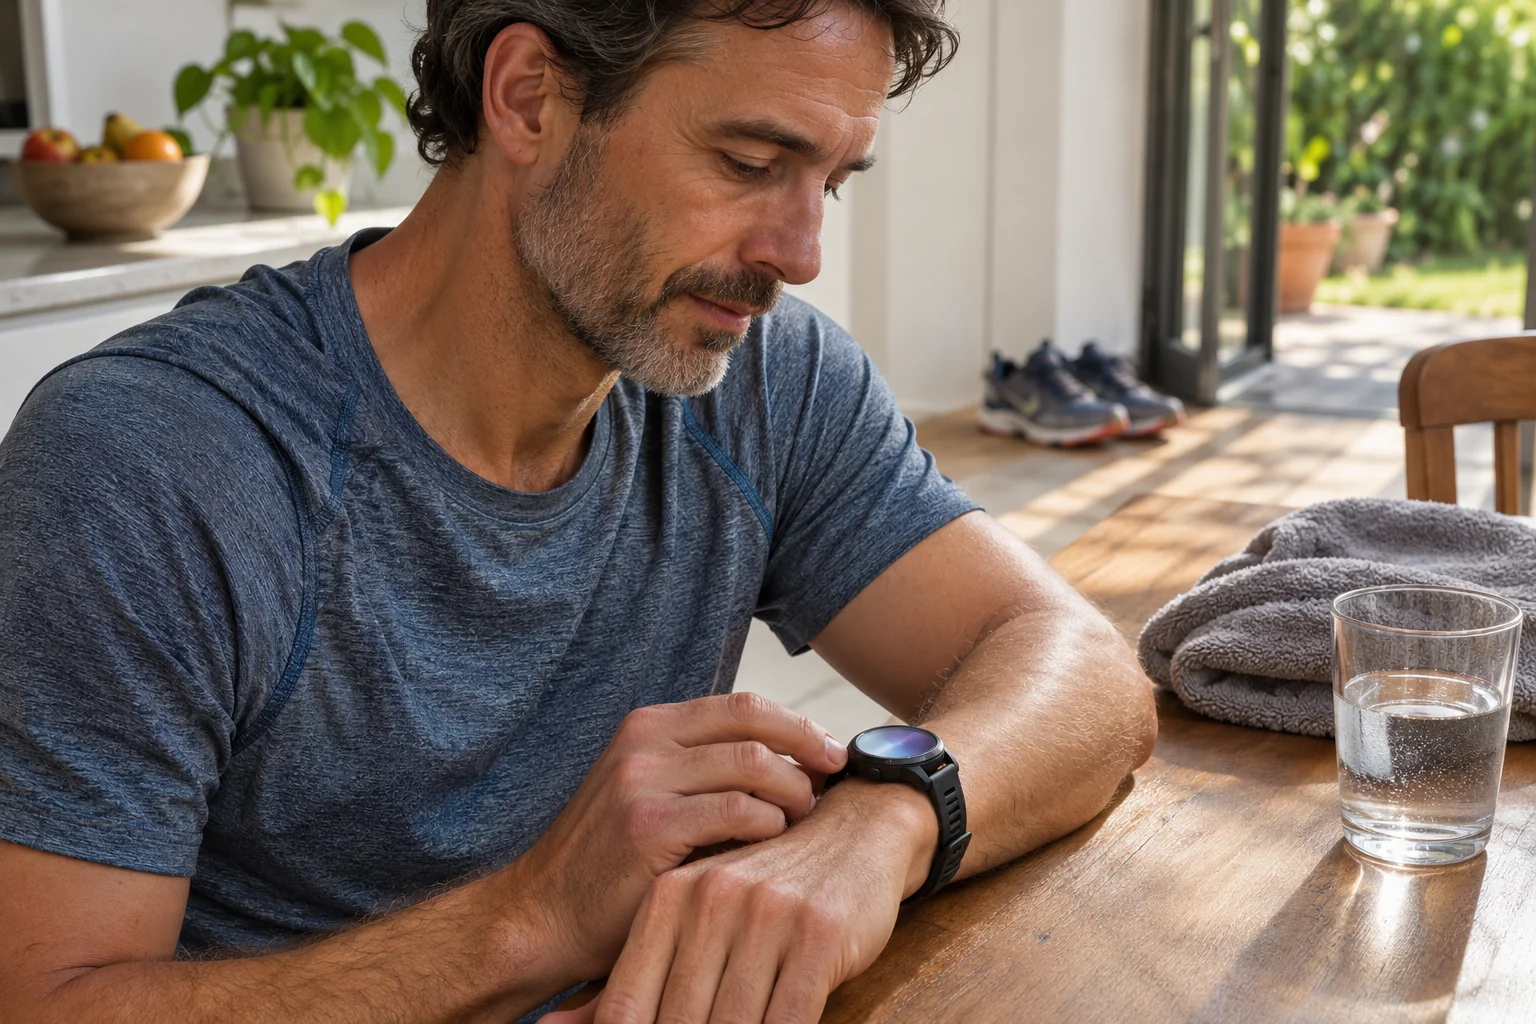
A finger device and an arm-worn watch do not automatically use the same measurement setup. Sensing location, signal path, attachment and processing may differ. A shared SpO₂ label concerns the estimated quantity rather than promising identical accuracy across devices. The product’s intended purpose and verified capability matter. Its name alone cannot make a sports-watch result equivalent to a clinical device.
Garmin’s Pulse Ox support page clearly states that the discussed wearables’ data are not intended for medical use or diagnosing disease. This frames interpretation. It does not mean they can never inform any observation, but rules out an exaggerated conclusion that the curve alone supplies a completed diagnosis or disease exclusion. Source: Garmin Pulse Ox questions.
A separately bought home finger meter does not automatically become an infallible reference either. Intended purpose, quality and correct use matter there too. If prescribed a device for health monitoring, follow that care plan and use instructions. Do not invent a personal decision scale from one differing instantaneous reading on a watch and another meter. Clarify both measurements’ conditions independently first.
 Enlarge image
What can make an optical signal uncertain?
The FDA lists several accuracy factors, including circulation, skin pigmentation, thickness and temperature. Nail polish may be relevant for finger devices too. This does not mean every listed factor has an identical effect on every wrist product. The point is that light-based estimates are conditional and sensor results need reading with their environment. Source: pulse-oximeter limitations.
Apple’s Blood Oxygen description also notes that even under favourable conditions a reliable recording is not assured every time. Skin blood supply at the wrist and movement can affect measurement. The manufacturer intends these data for general fitness and wellness. These are use boundaries for a particular product family rather than accuracy figures transferable to other brands. Source: Apple Blood Oxygen.
For your night, examine wear and recording continuity. Could the watch have shifted, was there an unusual position and are gaps visible? These are possible technical circumstances rather than explanations proven afterwards. Do not automatically dismiss a low point as artefact because it is uncomfortable. Nor must a high number be assumed flawless. Checking names uncertainty rather than selects the desired result.
A minimum and the whole night tell different stories
The lowest displayed value is a summary characteristic. Alone, it does not show how long a discrepancy lasted, how many suitable measurements existed or how the program handled uncertain points. A system often selects a minimum from many overnight data. Looking only at that number loses recording structure. Seek time, measurement mode and available details beside the graph.
In an invented example, nine of ten available overnight values are 97 per cent and one is 88. The minimum is 88 and the arithmetic mean 96.1. They highlight different characteristics; neither identifies the isolated point’s cause or duration. This is mathematics rather than a normal range or disease threshold. Calculate neither reassurance nor diagnosis from it. It teaches why a minimum is not the entire night.
A mean does not automatically resolve a concern either. Aggregation can hide a brief change, while a minimum can overemphasise one uncertain sample. Interpretation also needs recording circumstances and individual situation. If the app supplies only one summary number, what you can reliably infer is correspondingly narrower. Do not imagine a constant identical state every minute to fill missing detail.
A missing measurement is neither zero nor a period certainly without concern
A blank section means no displayed value is available there. It means neither zero per cent nor a confirmed usual state. Mark missingness separately in spreadsheet exports. Automatically entering zero creates data of a completely different meaning. Filling with a mean by hand can suggest unsupported continuity. Preserve original data unchanged.
In a numerical example, 96, 97 and a missing value contain two measured points averaging 96.5. Replacing the missing entry with zero gives a mean of 64.3, but this is not a physiological event: spreadsheet handling created it. Filling the gap with 96.5 makes a conveniently smooth result that remains an estimate. The example teaches data-handling error rather than home assessment of overnight oxygen.
Check measurement coverage when comparing nights if the app shows it. One recording may contain many usable points and another few. Identical minima or similar means may conceal different data volumes. Find how your watch collects and displays overnight data in its guide. An attractive continuous display does not necessarily represent a separately confirmed estimate for every second.
Sleep apnoea is a separate assessment question
NIH’s sleep-apnoea page describes assessing symptoms, risk factors and history, with a sleep study where needed. A sleep diary may help too. This differs from independently interpreting one sports-watch SpO₂ low point. A low point alone does not establish apnoea, nor does a favourable graph replace necessary assessment. Source: NIH NHLBI, diagnosing sleep apnoea.
For recurring sleep concerns or daytime symptoms, a timeline and observations can help a healthcare discussion. Note what occurs and how often, retaining watch data as supporting material. Do not assign a disease label from the graph. How you feel, symptoms and history matter to the professional; the display is partial information whose measurement conditions must be understood.
Do not confuse other watch sleep features operating under separate names and conditions with a simple oxygen-saturation graph. A device’s abnormality notification has its own intended purpose, support and limits. Shared overnight measurement does not make every feature identical. This article concerns interpreting an SpO₂ point on a sports watch rather than evaluating every possible sleep device.
 Enlarge image
What should you retain when seeking help?
A useful brief note includes exact watch model, measurement mode, night date, program version and the phenomenon actually seen: one low point, several recurring discrepancies or a long gap, for example. Describe any symptoms separately rather than reading them into the graph. “No symptom noticed” and “there cannot be a problem” are different statements. Technical data do not replace the complete personal situation.
Manufacturer support can explain wear, measurement mode and missing data. Assessing health concerns is another task. Necessary medical evaluation need not wait because a software ticket remains open. Conversely, a technical question need not immediately become a disease. The same traceable note may help both paths, while support and care answer different questions.
Share files privately through suitable channels with those who need them. An entire night’s health-related series is more than a running record and need not be uploaded to a public group. Retaining the original with a short circumstances description offers more than speculation attached to a screenshot containing personal data. The aim is an interpretable question and appropriate help rather than an online diagnosis contest.
Symptoms and persistent concern should not depend on one number
The FDA specifically stresses seeking care for severe or worsening symptoms rather than relying solely on a pulse oximeter. This is an important boundary for sports-watch interpretation too. With severe breathlessness, chest symptoms, fainting or another serious episode of feeling unwell, do not wait for another overnight curve; urgent help may be needed. A favourable displayed number does not override the immediate situation. Source: FDA, use and symptoms.
Recurring but non-acute uncertainty also deserves targeted resolution. Check technical conditions and discuss personal concern with an appropriate professional. Do not alter medicines, oxygen treatment or another care plan from a sports-watch graph. Existing individual professional instructions govern. This article provides general data literacy rather than a personal measurement or treatment protocol.
Overnight SpO₂ is read sensibly when origin, quality and context accompany the number. One low point is not a completed explanation, missingness is not zero and a smooth line does not exclude every condition. A traceable log helps frame a more precise question. Watch data remain an estimate produced under defined conditions, to interpret with your situation and appropriate professional assessment when needed.
Sources
How Futószív articles are prepared: our editorial guidelines.