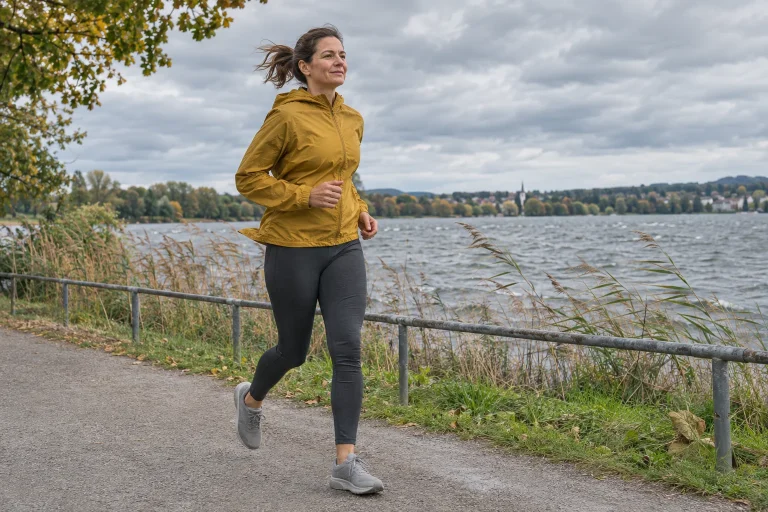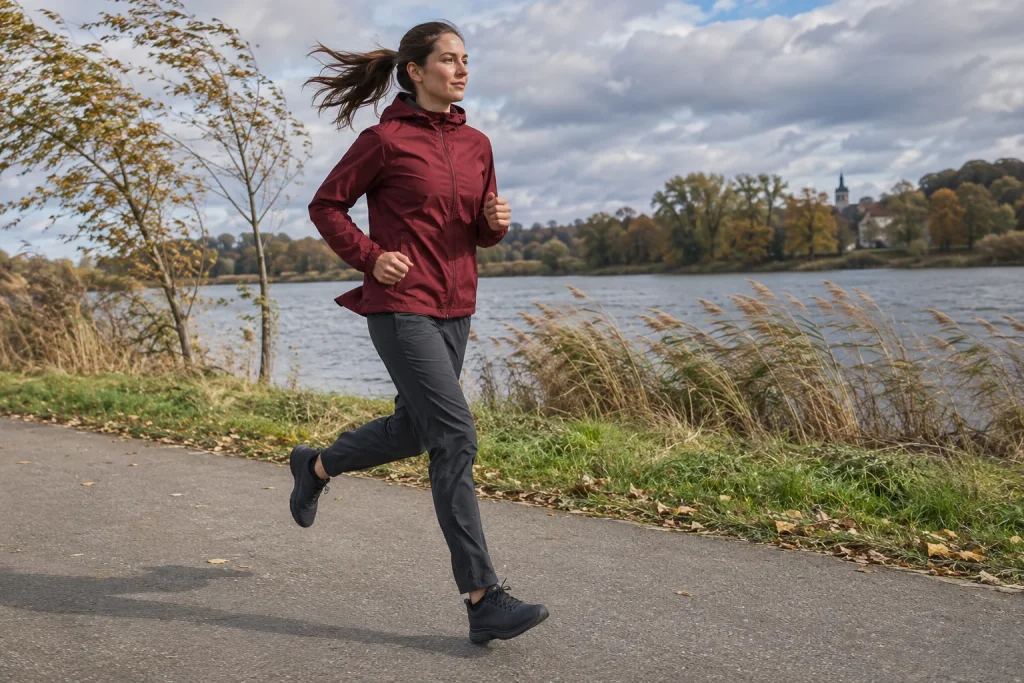
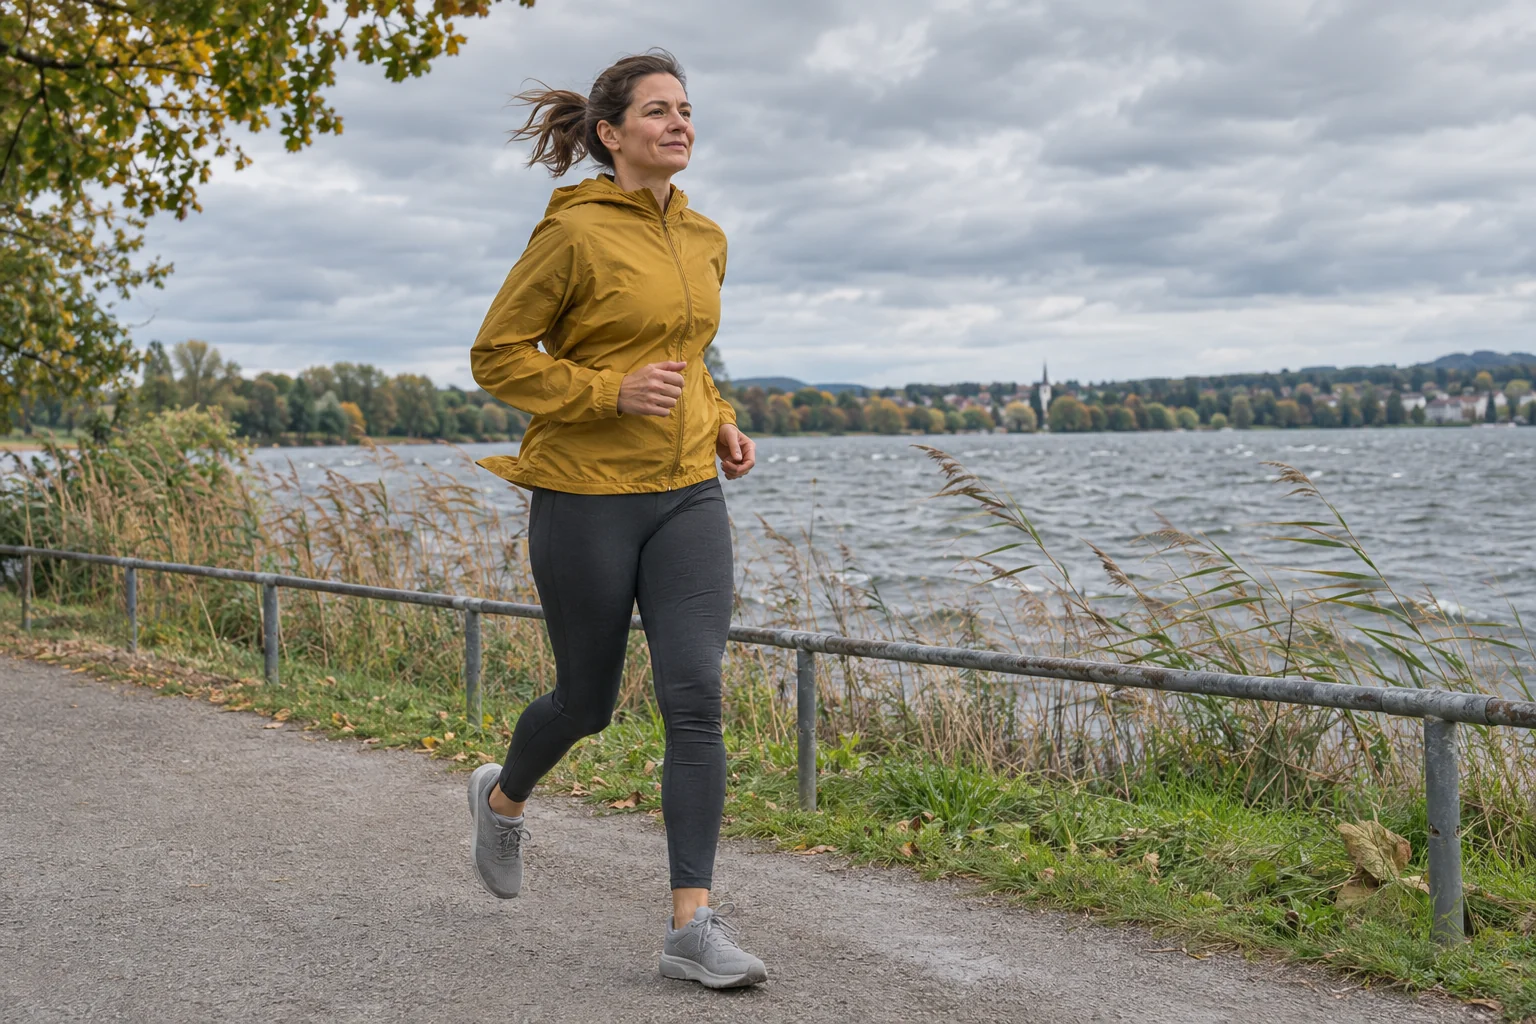
Your phone reports only a gentle crosswind, yet the air feels as though it comes from the front. The forecast is not necessarily wrong. Your body also moves relative to the ground while running, so the direction and speed of airflow relative to you can differ from a stationary weather instrument’s reading. Airflow caused by your movement and the ambient wind together shape what you feel on your face.
A few well-chosen examples make the distinction understandable. We examine still air, a headwind, slower and faster tailwinds, then combine vectors for a crosswind. We also clarify where a “westerly” wind comes from, why station data are not a personal airspeed measurement and why these cannot directly yield a precise running pace. The numbers are illustrations, not recommended weather limits for training.
You have different velocities relative to the ground and the air
Your ground speed describes how quickly you move along the route. Air-relative speed also accounts for the surrounding air’s movement. In still conditions, their magnitudes are equal in this simple model because the air is stationary on average above the ground. You move forwards through it, however, so airflow approaches your body from the front.
In our example, you run at four metres per second, equivalent to 14.4 kilometres per hour. In still air, this produces approximately the same relative airspeed from the front. When you stop, the component caused by your own movement disappears. Air can therefore feel different at a red light even while the ambient wind remains unchanged. Your experience after stopping should not retrospectively describe air conditions throughout the run.
Urban air is, of course, not perfectly uniform. Trees, buildings and local flows can alter conditions. For this calculation, we use straight, steady wind and constant running to separate the two reference frames. Differences along a real route enter the picture afterwards rather than replacing the definitions.
Meteorological direction names where the wind comes from
The Met Office’s official measurement guide names wind direction after the direction from which the air arrives. An easterly blows from the east; a westerly from the west. This differs importantly from an arrow showing the air’s motion: a westerly wind moves air eastwards. When an app draws an arrow, check whether its point indicates the origin or the direction of travel.
In our route example, you run east while a westerly blows. Air moves in the same direction as you, making it a tailwind. Turn around and run west, and the same meteorological wind becomes a headwind. The forecast has not changed; your direction has. You can therefore experience different relative airflow on the four sides of a loop under the same weather conditions.
Record wind direction and running direction separately. “There was a headwind” already describes their relationship; “a northerly wind on an eastbound section” also retains the underlying information. This can help interpret a return journey or another workout in a different direction. Do not confuse meteorological direction with a route arrow on the map: first state in words where the air comes from and where it goes.
 Enlarge image
Addition is simpler along a straight line
Keep our running speed at four metres per second. With an ambient wind of three metres per second directly against you, relative airflow is seven. The runner moves against the air, so the magnitudes add in this straight-line case. In kilometres per hour, ground speed 14.4 and wind 10.8 produce a relative value of 25.2. Both calculations mean the same thing when units are consistent.
With a three-metre-per-second tailwind in the same direction, the runner remains faster than the air. Relative airflow from the front is four minus three, or one metre per second. Here, a tailwind does not mean air approaching your body from behind and pushing your back; it means less relative airflow from the front. The meteorological tailwind and the relative wind felt by the body can therefore suggest different descriptions.
If the tailwind were six metres per second while you continued at four, the air would overtake you. Relative flow would approach from behind at two metres per second. At equal values of four, the simple model gives zero relative mean flow, although moving limbs and actual airflow remain more complex. Zero here concerns the difference between the selected straight-line mean velocities.
| Our example: running at 4 m/s | Ambient wind | Relative airflow |
|---|---|---|
| Still air | 0 m/s | 4 m/s from the front |
| Direct headwind | 3 m/s | 7 m/s from the front |
| Slower tailwind | 3 m/s | 1 m/s from the front |
| Faster tailwind | 6 m/s | 2 m/s from behind |
A crosswind requires combining directions too
With a crosswind, simply adding the two speed magnitudes is incorrect. If you run east at four metres per second and wind blows from the north at three, air moves south relative to the ground. Relative to the runner, air movement has westward and southward components: the approaching air comes from ahead and the north. The two perpendicular components jointly determine direction and magnitude.
Using a three–four–five right-angled triangle gives a relative speed of five metres per second, rather than seven, because the motions are not collinear. In this example, the approaching airflow is angled approximately 37 degrees towards the north from a direct headwind. A pure crosswind according to the station can therefore become diagonal airflow from the front for the runner.
In general, the relative air-velocity vector is air velocity relative to the ground minus the runner’s velocity relative to the ground. Here, a vector simply means a quantity with direction. Subtract east–west and north–south components separately, then calculate the resulting vector’s magnitude. First convert the meteorological “from” direction into the air’s actual movement direction; otherwise, the sign can be reversed.
Airspeed can inform force, but force does not automatically determine pace
In NASA’s basic drag equation, force in the simple model is proportional to relative speed squared, alongside air density, shape and area factors. Handling directions correctly is therefore more than a detail of map reading. A relative speed incorrectly taken as seven but actually five gives a square of 25 rather than 49. The computational difference can already be substantial when estimating force.
Body shape and airflow direction in the equation matter too. A crosswind may not permit the same reference area and drag coefficient as a direct headwind. Do not therefore insert the triangle unchanged into a universal watt or calorie calculator for everyone. Geometric relative speed is well defined in the ideal example; actual airflow around a person is a more detailed task.
The controlled wind-tunnel study by Yamashita and colleagues measured metabolic and thermoregulatory responses to airflow from different directions. Its results showed that physiological effects cannot be interpreted solely from a simple speed difference, while the cooling role of airflow is another question. A relationship observed in that sample and experimental environment is not a personal pace prescription for every street.
A station’s ten-metre wind is not a measurement at your chest
In the NOAA digital forecast definitions, sustained wind refers to the specified time and a height of ten metres; gusts are a separate element. The Met Office measurement description also highlights height and surrounding obstacles. These are standardised, interpretable meteorological data. They are not a direct measurement of airspeed around a runner’s chest beside a particular line of trees at that moment.
An open riverbank and a narrow street between buildings can create different local environments along a route. This does not make the forecast worthless: it describes general conditions modified locally. Do not call a retrospectively calculated relative speed that appears precise to a decimal place an actual measurement around the body if it derives only from a distant station’s average.
Time averaging can hide changes too. A runner may feel brief gusts while the app displays sustained wind. The two describe different time windows. “Variable and gusty” or “steady for a longer period” can be useful diary observations if you actually experienced them. You need not invent an estimated peak value; describing the phenomenon is informative too.
 Enlarge image
A four-direction loop in the same wind
In our map example, you run a square loop at the same speed along every side. Ambient air moves west to east at three metres per second, while you run at four on each straight. Relative magnitude is one eastbound, five northbound, seven westbound and five again southbound. Neither wind nor running speed changed; only route direction changed what approached you.
Calling the entire loop simply “windy” therefore merges much information. On its northbound and southbound sides, diagonal airflow approaches from different shoulders; on eastbound and westbound sides, magnitudes differ greatly. Direction changes continuously around corners. A minute’s average pace or the whole loop’s average heart rate can summarise these different demands, even while individual sections felt different.
When comparing a previous loop, identify its most recognisable sections. “There was a headwind throughout the open westbound straight” is more concrete than a theoretical correction calculated for the entire route. Route, general wind direction and local observation together help explain the different experience. Relative-wind physics can refine the diary rather than grade the runner.
Three checks before using a wind-correction number
First clarify direction: where did the meteorological wind come from, and which way did you run on that section? Second, align units: do not add metres per second to kilometres per hour without conversion. Third, ask which spatial and temporal information you have. Is it a forecast average, a nearby station measurement or actual local airspeed? Calculations offer different certainty for these inputs.
Make model assumptions visible too. Our examples used constant-direction wind, known running velocity and motion in a plane. If a real route turns frequently, enters shelter or encounters gusts, a simple constant multiplier can only be a rough approximation. Physics remains useful: it helps identify precisely which input is insufficiently known.
For a runner, better understanding is the main gain. Movement-induced airflow on a still day, air still coming from the front in a slower tailwind and a crosswind’s diagonal relative direction need no longer be mysterious. Ground-relative and air-relative velocities remain separate concepts that together explain experience. This can produce more accurate observation without a personal pace guarantee.
Sources
- Met Office: measuring wind, direction conventions and local surroundings.
- NOAA National Digital Forecast Database: definitions of wind and wind gusts.
- NASA Glenn Research Center: the basic drag equation.
- Yamashita and colleagues: airspeed and direction in a controlled running study.
How Futószív articles are prepared: our editorial guidelines.