A coloured precipitation field covers the park on your phone, while the pavement outside the window looks dry. At another time, the map is nearly empty yet you arrive in drizzle. Neither situation necessarily proves radar is useless. First clarify which data you are viewing, when they were produced and which part of the atmosphere they describe. A radar image is not equivalent to instantaneous ground measurements installed on every square metre of your route.
For a runner, radar is valuable for preparation and following conditions. It can show the spatial pattern of precipitation fields, while your own surface observations and official forecasts add different information. Below, we separate the reflected signal, the estimated precipitation quantity and the product displayed on a map. We then develop an original checking routine that avoids important misunderstandings without requiring you to become an amateur meteorologist.
Radar measures a returning signal rather than water fallen onto the pavement
The NOAA reflectivity explanation states that radar measures power returning to the antenna. Precipitation intensity is inferred from it; properties of precipitation particles matter in the relationship too. Thus dBZ is a reflectivity quantity, while millimetres per hour expresses intensity: they are not arbitrary labels for the same number. If two services display different scales, read the legend before comparing colours.
A map drawn over the ground can easily suggest that all data came directly from the surface. Where information is displayed does not, however, describe the entire measurement. A mapping app can show different data and processing against similar backgrounds. Begin your check by finding the layer’s name. Radar, satellite imagery, accumulated precipitation and forecasts may answer different questions even if the phone draws coloured patches for each.
Zooming the screen is not the same as increasing measurement detail. Zooming precisely to your own street does not necessarily turn the underlying data into an observation valid for a house number. A location marker helps orientation, but should not be read as a rain gauge reporting from beside your shoes. Alongside radar, therefore consider the extent of the entire route and the currently observable surroundings.
A more distant beam may sample a higher and wider part of the atmosphere
The NOAA educational material on radar beams shows that a beam broadens with distance from the radar and its height above the surface can also increase. Atmospheric propagation conditions can modify its path further. A more distant map point therefore does not have the same sampling situation as the area immediately around the station. Because height and spatial resolution matter, inferring surface conditions from an atmospheric signal requires interpretation rather than merely reading a screen.
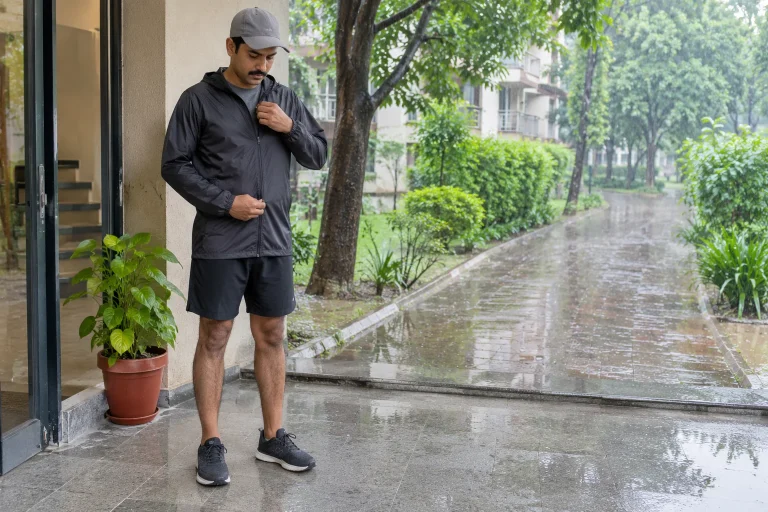
This helps explain why your observation and the map need not immediately be set against each other. They may provide information about different details and different volumes of space. A dry entrance shows only that entrance’s condition; a signal from a higher air layer does not inspect the entire running loop’s ground. Recognising the distinction does not yet identify the specific cause of disagreement, but stops expecting the map to measure something it does not promise.
Coverage and missing-data indicators therefore matter in an app description too. Do not automatically treat an area without data as precipitation-free. If the legend is unclear, consult the provider’s help or use an official display whose product description you can understand. You need not draw a radar network yourself; what matters is not filling unknown areas with unsupported certainty when planning an outing.
 Enlarge image
A signal can appear without precipitation reaching the ground
The Canadian weather service’s radar explanation specifically discusses virga: falling precipitation may evaporate in a lower, drier layer before reaching the surface. Radar can therefore indicate precipitation you do not experience as rain on the ground. This is one possible explanation, rather than an automatic diagnosis for every dry pavement and coloured map point. A screenshot and a glance through a window cannot establish the specific atmospheric process with certainty.
The same explanation uses a beam passing too high to show how radar can partly miss low-level precipitation. Differences between map and ground can therefore occur in both directions. For a runner, an apparently empty image is not a general guarantee of a dry loop either. Local observations, fresh provider information and route planning together can produce a more useful picture.
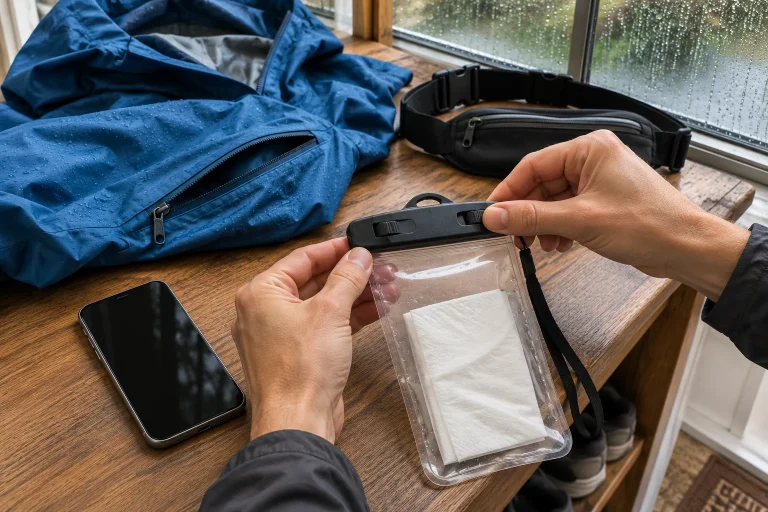
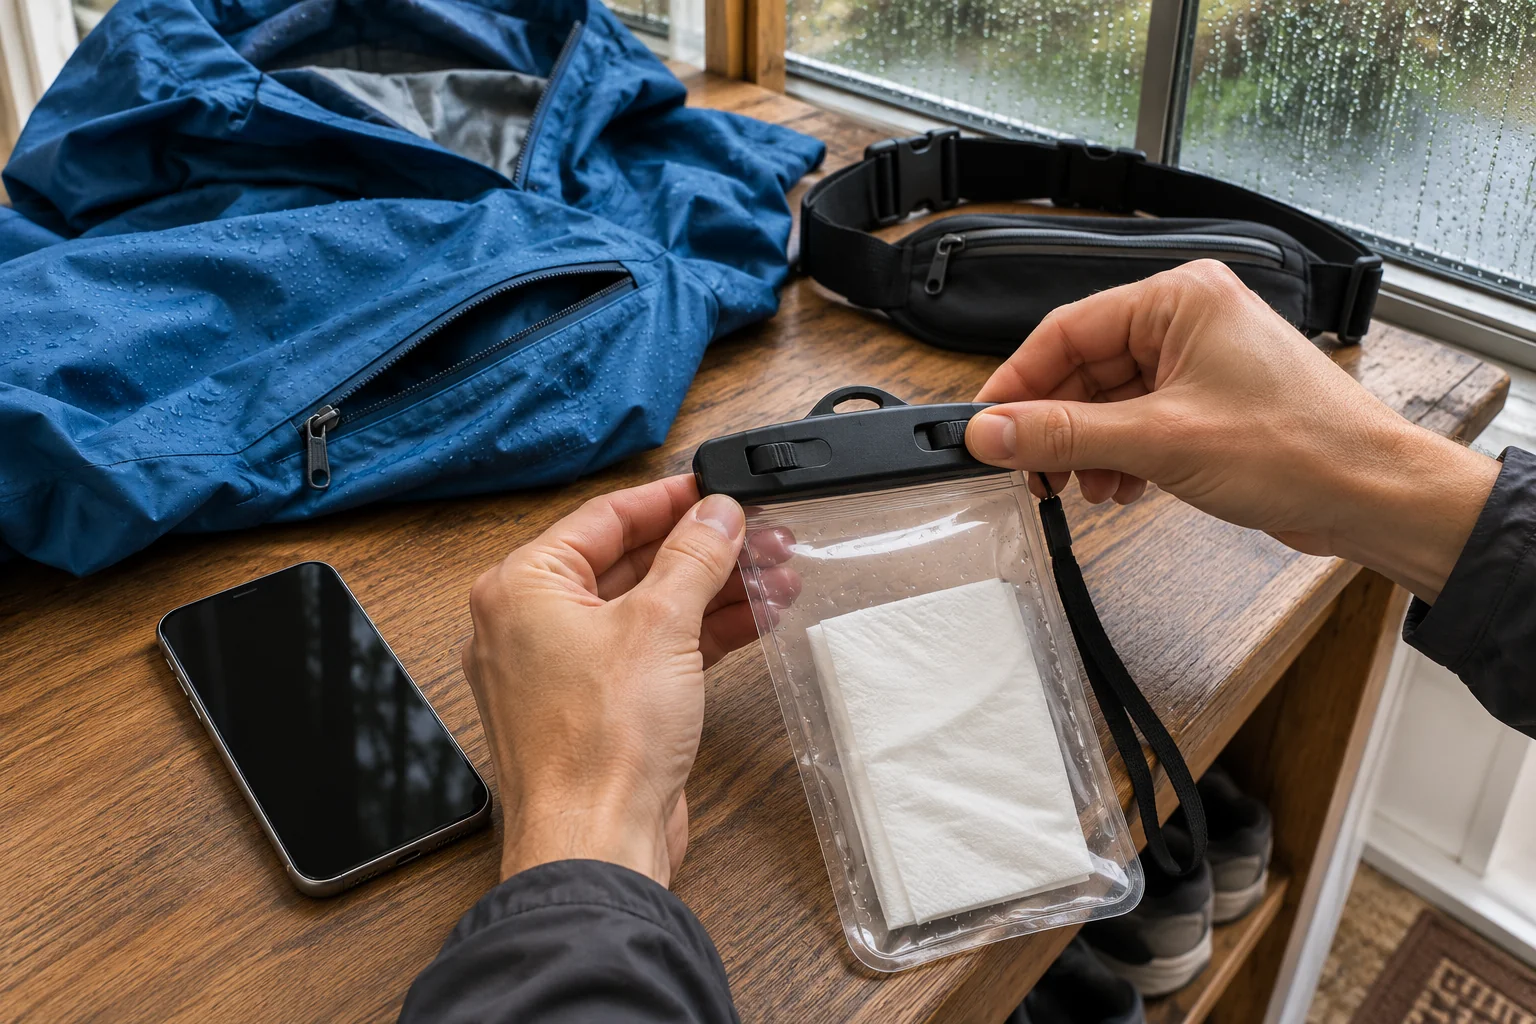
If you start in dry conditions, do not assemble equipment solely for that moment. Duration, getting back and accessible shelter also belong in your planning. You need not predict rain with certainty to have an appropriate alternative. The aim is not personally verifying every radar image outdoors, but being able to modify the run clearly when actual conditions change despite the information available.
CMAX and PseudoCAPPI are not two different kinds of weather
The detailed 2023 description of Hungary’s radar network distinguishes column maximum, or CMAX, from the PseudoCAPPI product. The former uses the maximum measured reflectivity above a point, while the latter uses a hybrid approach to aim at an estimate closer to the surface. They can therefore show different images of the same situation. The document is a historical methods description: separately check the product name and legend of the interface currently used rather than assuming every app displays exactly this with identical settings.
Do not immediately call a difference between products a provider error. First check whether the compared quantities and processing are the same. In your notes, record the layer name alongside the app name. Writing only radar said something different prevents retrieving the actual disagreement later. More precise naming also helps when consulting provider help or information to understand the display.
You need not professionally compare several products before every run. Consistently using one reliable, familiar display may be more practical than constantly switching between five maps. Know what you are looking at and which question you are asking. Do not infer outing safety or departure time from impressive colours on an unidentified layer. Official forecasts and warnings remain separate necessary information.
Interference and obscuration: neither every patch nor every gap means rain
The Japan Meteorological Agency information explains non-precipitation echoes, anomalous propagation and attenuation caused by precipitation. Quality control addresses many problems but does not remove every error. This is not a reason to discard radar imagery, but to avoid determining complete surface weather from one coloured shape. Knowing possible error types does not make every reader able to identify a specific case with certainty.
If a patch looks unusual, first refresh the appropriate interface, check the date and consult available official information. Do not post your own unverified claim of a false radar echo based only on shape. Several explanations may fit the pattern on a phone, and your local observation covers only a limited area too. If the provider reports an outage or missing data, treat that as separate information alongside the image rather than omitting it from comparison.
Obstructed observation and a weak signal do not justify optimistic route selection. An area less prominent on radar may have important conditions indicated by another observation or warning. Make clear which source answers which question in your planning. Following precipitation spatially is useful, but layer colours alone cannot settle storm danger, a flooded section or poor visibility.
The timestamp comes before the animation
In your checking routine, the image’s date and time should precede interpreting colours. Check its time zone, which frame the animation is on and whether it is genuinely the latest available image. A previously opened page or rewound sequence can easily show another time than you remember. An accurate phone clock does not prove the weather layer displayed inside it is current.
Successive past images can help follow changes, but not every advancing frame is an observation. If an interface offers a sequence extending into the future, find where estimation or forecasting begins. Do not simplify movement on the map into a certain arrival minute for your own route. Conditions and your location can change while running, so do not cling to one departure snapshot later regardless of circumstances.
| Check | What should you record when comparing? | Common misunderstanding |
|---|---|---|
| Product | The actual layer name and scale | Every coloured map measures the same thing |
| Time | The frame’s date, time and time zone | An image opened now must be a current measurement |
| Space | The location of the whole planned loop, rather than just its starting point | The location marker sends data from beside your shoes |
| Further information | Local observations, forecasts and warnings separately | Empty radar settles every other weather question too |
The table is our own app-use method, rather than a weather-forecasting algorithm. It also helps when two acquaintances see different things on their phones: comparing product, time and place can resolve many misunderstandings without immediately calling either device faulty. An unexplained detail may remain afterwards. The aim is more accurate information handling, rather than proving one app provides the sole truth in every situation.
 Enlarge image
Radar is one tool in a running plan, rather than a guarantee of dry conditions
Before departure, ask what answer you need. Are you preparing for a short, familiar local loop or travelling to a longer, more distant route? When would you reach the distant section, and how would you return? These are your own outing-planning questions. Current radar may help with a different time horizon and area from those your outing requires. Assemble equipment and an alternative for the whole task rather than one clear map point.
A dry pavement and coloured radar can therefore be meaningful information alongside each other. One is a surface observation, the other an image derived from processed atmospheric measurements. You will not always establish the cause of disagreement alone, but can perform important checks: precise product, time, place, your own observation and official information. Radar retains its usefulness without being burdened with guarantees it cannot provide for every condition of a running route.
Sources and the place of the original method
NOAA: Radar Images – Reflectivity; NOAA: Radar Beams. Environment and Climate Change Canada: About Canadian historical weather radar – virga and a beam passing above precipitation. Hadvári and colleagues: measurements of the OMSZ radar network, 2023 – Hungarian methods description, particularly CMAX and PseudoCAPPI. Japan Meteorological Agency: Weather Radar – limits of observation and interpretation. HungaroMet: current radar interface; HungaroMet: weather warnings. The table and checking routine applied to a running outing are original editorial applications, rather than an individual weather forecast.
How Futószív articles are prepared: our editorial guidelines.