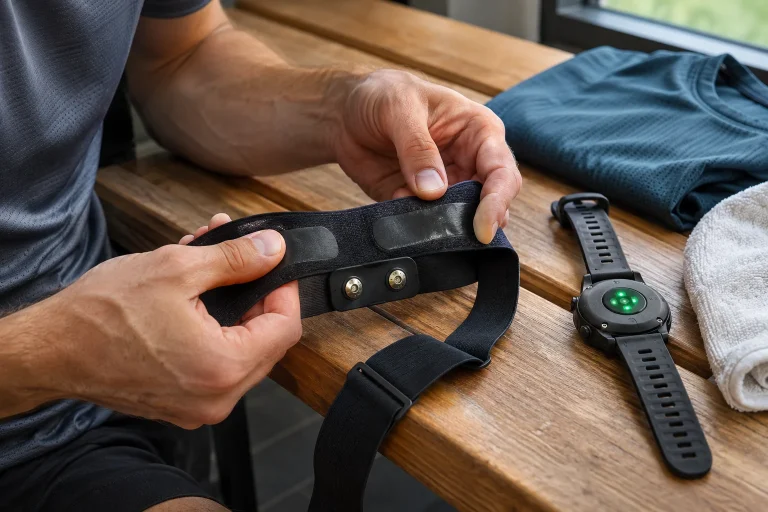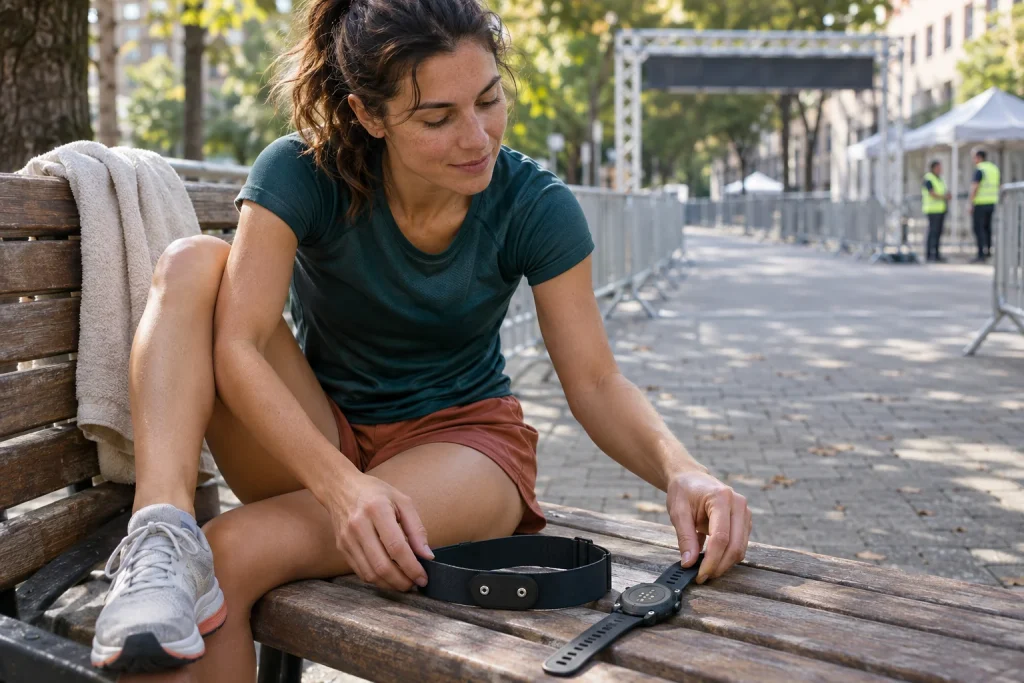
In the marathon’s second half, the same pace corresponds to a higher heart rate. This may be an interesting response to exertion, but a poorly fitted watch or faulty comparison can draw a similar curve. Begin with signal quality: calculate decoupling only after clarifying what happened in the sections examined.
Two diverging curves are not yet an explanation
Speed can describe running’s external task, while heart rate is one accessible sign of the body’s response. A changing relationship over prolonged time is commonly called heart-rate–pace decoupling. Describing it is not establishing its cause. The curve shows a relationship in recorded data; interpretation also requires measurement conditions and the run’s circumstances.
A study processing data from 82,303 recreational marathon runners examined relative heart rate in relation to speed expressed relative to critical speed across race sections. Decoupling’s extent and onset were associated with performance. Research group boundaries are not personal health thresholds, however, and the analysis did not establish a single cause of every runner’s slowing.
Your first question should therefore not be whether your marathon produced a good or bad percentage. First establish whether the sections are genuinely comparable and reliable. A ratio between an inaccurately measured, congested climb and a flat, cleanly recorded early section can produce an exact number without accurately describing your durability.
Save the original run and its circumstances
Before cutting, correcting or reuploading anything, retain the original activity. Note the watch and heart-rate source, whether a chest strap was used and any remembered connection problem. A short post-race note becomes valuable later: when you stopped, where congestion occurred, when you adjusted the strap and where weather changed substantially.
An app screenshot does not always reveal details. The Garmin FIT-processing documentation treats timestamped samples, events and summary messages separately. A data file can contain information with different roles. A section average and individual timepoint data show different things, while the graph may involve further presentation choices.
Keeping the raw file does not mean everyone must program an analysis. It preserves a traceable original when two services display different averages or times. Record corrections as separate notes rather than silently rewriting memories. This also keeps clear which sections lack sufficient information for conclusions.
First inspect the heart-rate signal’s shape
Look across the entire run for abrupt, almost vertical jumps, long gaps and unusually straight sections. These are not automatically errors, but useful places for closer checks. Did pace, terrain or cadence change at the same time? One outlier should not define the whole marathon, particularly when neighbouring data differ greatly.
Optical wrist measurement is influenced by fit, skin contact and surroundings. The official Apple guide specifically mentions strap fit, skin perfusion, cold and movement effects. These are manufacturer considerations for particular devices; consult another watch’s own guide too. The principle is that retrospective percentage arithmetic cannot repair a number arising from poor contact.
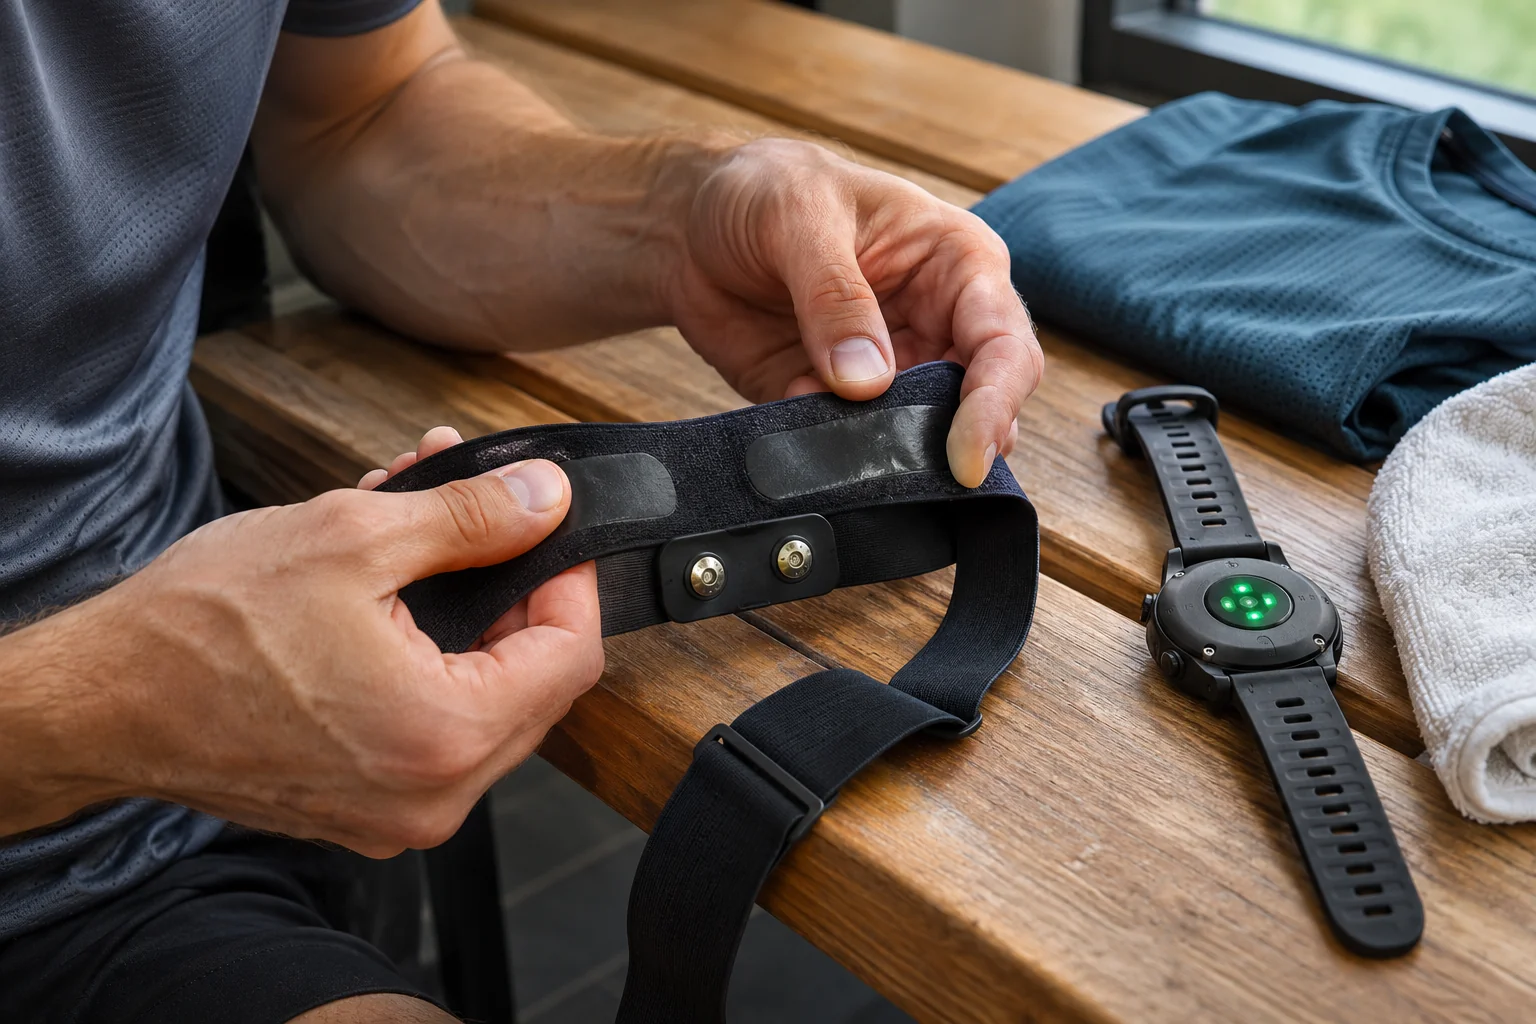
A chest strap does not remove the need to check either. Note battery, strap condition and pairing problems if experienced. Data-quality assessment does not aim to declare one sensor flawless in every condition. It aims to establish how much you can rely on the signal recorded in that race section.
 Enlarge image
Why is heart rate following cadence suspicious?
With optical sensing, repetitive movement signals can interfere with estimated heart rate. The research examining sources of error in wearable optical heart-rate monitors discusses such periodic signal interference. In what is commonly called cadence lock, displayed heart rate may conspicuously stick to movement repetition rate. This is a possible measurement issue, not the automatic explanation for every similar number.
Suppose cadence remains around 170 in a fictional recording and, after a sudden jump, heart rate stays near the same value. Examine both signals on the same time axis alongside speed and the runner’s recollection. Agreement may raise suspicion, but heart rate and cadence can also coincide accidentally or under genuine exertion. Identical numbers alone do not prove sensor error.
Without another reliable measurement for that period, marking the section uncertain may be better than correcting it with an imagined value. In particular, do not draw in a desired heart rate to make the result fit expectations. An honest gap is more useful than a retrospectively constructed, overconfident story.
Match similar sections, not just equal pieces of time
Choose early and late sections with as similar a task as possible. Review elevation, turns, surfaces, wind-exposed areas and aid stations. Two five-kilometre sections can differ completely: one flat and clear, the other involving climbs and queues. Simply averaging them may combine several influences within the ratio.
The research did not compare the opening moment with the finishing sprint; it used specified race sections. Justify selection in your own analysis too. Warming up, congestion after the start and a separate final effort differ from established steady running. You seek matching windows, not details producing the most attractive result.
If the course offers no genuinely similar sections, state that beside the result: for example, the later part was hillier and windier, so its ratio cannot be interpreted purely as change over time. Every race need not yield the same metric. A well-justified omission helps compare only appropriate data with other occasions.
Stops, auto-pause and speed also shift the average
Official race time keeps running while you stop at an aid station. Your watch may auto-pause, however, and the app may calculate separate moving time. Including stops in one window’s speed but filtering them from the other applies different comparison rules. This can alter the heart-rate–speed ratio even with a similar actual response.
Use a consistent timing basis and check what the service calls average pace. FIT documentation gives different roles to aggregate durations and timepoint samples; the practical question is which the program used. If unclear, do not compare it directly with another app’s differently named metric. Two displayed percentages may come from different operations.
Convert pace to speed before calculating. A fictional early section at 10 km/h and average heart rate 150 gives 15 beats per minute per km/h. Later, 9.5 km/h and 155 give approximately 16.32. The late-to-early ratio is 1.088, or a change of about 8.8% under this chosen description. This is arithmetic illustration, not a good–bad boundary.
Handle maximum-heart-rate error separately
Some analyses express heart rate relative to maximum. If the program’s maximum is an old automatic estimate or erroneous spike, your absolute zone picture may mislead. Record this input’s origin and relevant period. A study’s own determination rules need not match those used by your watch or app.
An important mathematical detail: if early and late heart rates are divided by the same constant maximum and the resulting relative ratios then divided, that constant may cancel. Zone interpretation can still be wrong. Maximum heart rate therefore does not affect the final number identically in every decoupling formula. Examine the exact formula instead of generally “Correcting” the metric.
For the same reason, similarly named metrics from different services should not be compared unconditionally. One may use a heart-rate–speed ratio, another a different exertion estimate or windows. A percentage does not identify the method. If the formula is unavailable, say you are following that service’s own metric rather than a universal physiological constant.
 Enlarge image
Turn analysis into a meaningful diary entry
Separate data quality, calculation rule and interpretation in the final note. For example: the heart-rate signal appears continuous in the two selected sections; terrain is similarly flat but the later part was warmer; averages use the same timing basis; the ratio increased. This shows both observation and the circumstance limiting its explanation.
“I am not calculating a metric because the later heart-rate signal is uncertain” is a complete entry too. The race remains analysable through splits, pacing, fuelling events and experience. Missing sensor data do not erase the run; they determine which questions can responsibly be answered.
Consistent data from several similar runs may later support a better coaching discussion than one isolated percentage. Still view recurring patterns with their circumstances. If a change does not fit other observations, first check data and task differences before constructing a major preparation narrative from it.
Prevent typical data problems at the next race
Turn the lesson into brief technical preparation. Check comfortable, stable strap fit, sensor charge or battery, pairing and which heart-rate source the watch actually records. A new sensor or setting introduced on race day may create more uncertainty than it resolves. Learn familiar operation on earlier runs.
Choose auto-pause and lap timing deliberately, then remember the rule selected. The same setting is not most practical for every task, but comparison afterwards requires knowing what happened. The aim is not the maximum possible number of screen fields. What matters is clarity about the actual signal and timing basis used.
Marathon heart-rate–pace decoupling can thus remain a useful descriptive tool. Reliable recording first, comparable sections second, cautious explanation last: this sequence makes the number meaningful. Understanding performance requires recognising exactly what the measurement can support, rather than salvaging data at all costs.
Sources
- Smyth and colleagues: decoupling of internal and external workload in the marathon.
- Apple: more accurate measurements and limitations of optical heart-rate sensing.
- Bent and colleagues: sources of inaccuracy in wearable optical heart-rate sensors.
- Garmin: processing timestamps and messages in FIT activity files.
How Futószív articles are prepared: our editorial guidelines.