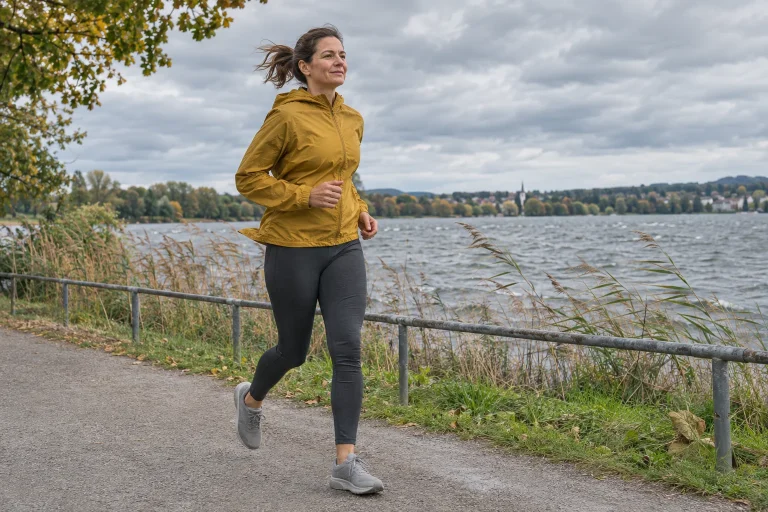
You fought the wind throughout the outward leg and finally felt relief coming back, yet the whole route still seems slower than in still air. Several different phenomena may explain the feeling. Drag changes nonlinearly with relative airspeed, and times for equal-distance sections run at different speeds cannot simply be averaged either. An out-and-back route is not an automatic account in which a tailwind precisely refunds every earlier loss.
We first create a simple model and openly state its assumptions. Then we examine mechanical force, work over each leg and the consequences of chosen pace separately. Our numbers are not weather-based pace calculators. They show how asymmetry can arise and why the whole person’s physiological response must be considered separately from a partial physical calculation.
A model that makes the difference clear
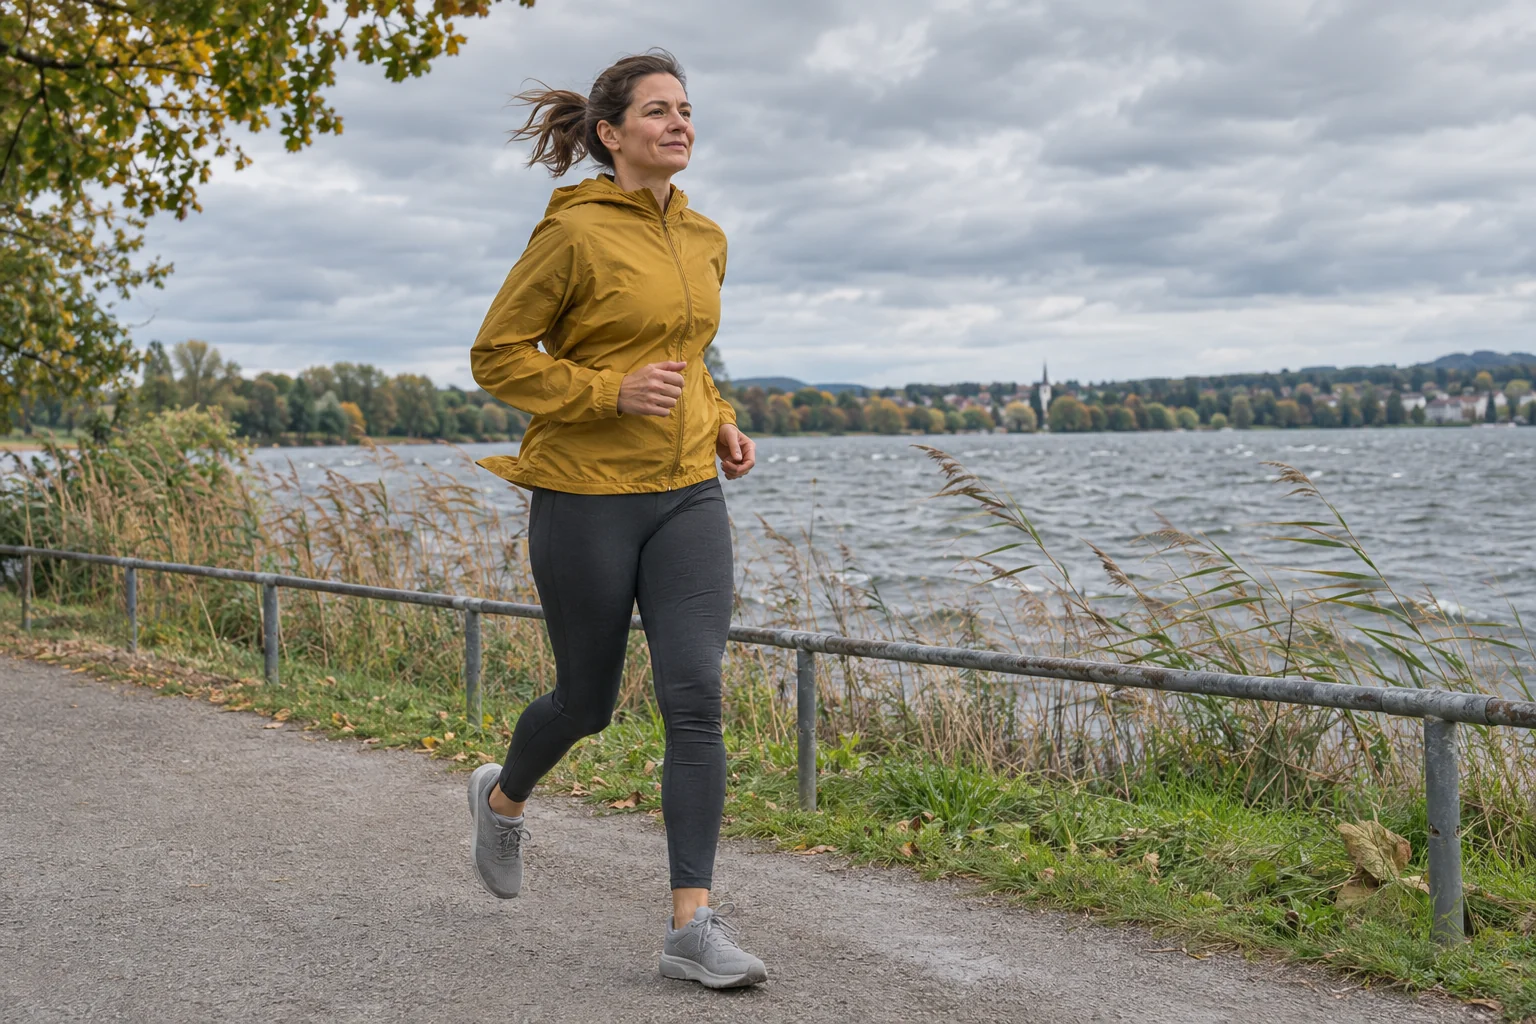
Imagine a flat, straight, open route with steady wind. You cover equal distances out and back at the same ground speed. Wind blows exactly along the route, against you on one leg and behind you on the other. The runner is faster than the wind both ways, so relative airflow still comes from the front on the tailwind leg. This is an important condition for the simple squared-speed calculation.
The basic drag equation makes force proportional to relative speed squared in a simple model. We combine the other factors into one constant: let force be k × u², where u is relative airspeed. The chosen effects of air density, body shape and reference area are included in k. We hold it constant in this example, although a real person and airflow are not that simple in every situation.
Let v denote the runner’s ground speed and w the ambient wind magnitude. Relative speed is v+w outward and v−w returning. The average of the two forces is therefore k × [(v+w)²+(v−w)²]/2. Expanding the brackets leaves k × (v²+w²). A positive w² term appears alongside the still-air k × v². The headwind’s increase and the tailwind’s reduction therefore do not cancel in this model.
Our force calculation: three, four and two metres per second
Choose a running speed of three metres per second and wind of one metre per second. Relative speed is three in still air, four against the wind and two with it. For illustration, set k to 0.30 newtons/(metre/second)². This is an assumed model parameter, not measured aerodynamic data from a particular athlete. It yields forces of 2.7 newtons in still air, 4.8 in a headwind and 1.2 in a tailwind.
The headwind increases resistance by 2.1 newtons from still air, while the tailwind reduces it by only 1.5. Average model force over the equal-distance, equal-speed sections becomes three newtons rather than 2.7. These numbers illustrate the squared relationship. The resulting ratio applies only to the selected aerodynamic component, not an increase in the cost of the entire run.
Different wind and running speeds would give another ratio. If a tailwind moved faster than the runner, relative flow could reverse, and the simple expression written for two opposing forces would no longer apply unchanged. Include the model’s domain alongside its result. Understanding a phenomenon through an equation is not an unlimited promise for all weather.
| Our model: running 3 m/s, wind 1 m/s | Relative speed | Assumed drag |
|---|---|---|
| Still air | 3 m/s | 2.7 N |
| Headwind | 4 m/s | 4.8 N |
| Tailwind | 2 m/s | 1.2 N |
 Enlarge image
Force, mechanical work and power are not interchangeable
Mechanical work against a constant force opposing travel is simply force multiplied by distance. Running two kilometres against the wind and two with it gives drag-related work of 4.8 × 2000 + 1.2 × 2000, totalling twelve thousand joules. In still air, the same four thousand metres gives 2.7 × 4000, or 10,800 joules.
The model difference is 1200 joules, but this cannot directly determine dietary kilocalories, total oxygen demand or fatigue. We have calculated an external mechanical-work component rather than every metabolic process. The analytical running model by Jenny and Jenny also separates mechanical components associated with braking, vertical motion and drag. Separating components helps avoid explaining the entire run from one force.
For mechanical power, connect force with travelling speed in the relevant reference frame. In our ground-relative example at three metres per second, the headwind component is 14.4 watts, the tailwind component 3.6 and the still-air component 8.1. These are not a sports watch’s total running-power values. This differs from multiplying force by relative airspeed to discuss power relative to the air.
When hearing “power grows with the cube of speed”, therefore ask which speed and which power are meant. In still air, ground-relative and air-relative speed magnitudes match in a simple case; ambient wind separates them. Further relationships connect the partial mechanical calculation with a person’s total metabolic rate. The cubic shorthand alone is not a personal running formula.
Changing pace also changes how time is averaged
Many runners do not force the same pace into a headwind, instead adapting speed to their chosen effort. The two legs can then have different speeds. Establishing actual values would require knowing the runner–environment relationship; the simple force equation above does not supply it. Calculating section times from chosen speeds is nevertheless instructive.
In a new fictional example, run two kilometres at 2.5 metres per second and the other two at 3.5. We chose these values rather than deriving them from constant metabolic power. The slower leg takes eight hundred seconds and the faster approximately 571. Total time is 1371 seconds, giving an average speed of approximately 2.92 metres per second. It is not three, despite that being the two speeds’ arithmetic mean.
The difference arises because equal distances mean spending longer on the slower leg. Four thousand metres at a steady three metres per second would take approximately 1333 seconds; the fictional two-speed case takes roughly 38 seconds longer. This is not a specific loss predicted from the wind above, but the arithmetic relationship of time and distance. Symmetrical speed increases with a tailwind and decreases into a headwind do not guarantee the same total time either.
The actual physiological response is more than a diagram of squared force
The wind-tunnel experiment by Yamashita and colleagues directly examined metabolic and thermoregulatory effects of airspeed and direction in fourteen participants. The authors described a smaller headwind effect and greater tailwind effect than earlier estimates when seeking to avoid confounding from rising body temperature. This reminds us that a mechanical illustration does not fully describe every physiological circumstance.
The simple model therefore offers one clear possible explanation for the title’s question, rather than a law applying to every runner and temperature. Metabolic effects and thermal sensation can change together, while airflow is not collinear on every route. If model assumptions are unmet, reinterpret the result. A precise statement also identifies effects left outside it.
In personal observations, record pace, overall effort and thermal experience separately. “Coming back felt easier” matters, but does not reveal how much mechanical work or oxygen you saved. Your data’s strength is preserving the actual circumstances of the run. You do not need to retrospectively assign an exact energetic percentage to every sensation.
A one-direction race and out-and-back training are different questions
A study analysing decades of Boston Marathon data related wind direction and other weather factors to finishing times. Tailwinds were associated with better results in the groups examined. This is an observational relationship based on real race data alongside several environmental variables. It is not a controlled out-and-back wind experiment and does not establish every number in our model.
In a race travelling predominantly one way, a runner does not necessarily face an equal section in the opposite direction. A loop includes many directions; an out-and-back changes travel direction while wind may strengthen or turn in the meantime. Comparing courses therefore requires the full direction geometry and timing. A simple “windy day” label does not describe each runner’s demands on each section.
Interpreting race data can also involve course profile, the field and other weather conditions. Do not fully reconstruct one year’s faster results from a single meteorological number. Such analysis helps understand population-level relationships. Direct second-by-second corrections for your next workout’s target pace would need further evidence suited to the person and route.
 Enlarge image
A real route introduces further variables
A crosswind requires vector calculation of relative airflow, while buildings and trees can create local shelter or other flow conditions. A weather station differs from the runner in height and location. Real outward and return legs may therefore differ from the model’s two neat, steady halves. This is no failure of reasoning when we acknowledge from the start that the model highlights only one relationship.
A useful diary entry might read: “Open embankment section, sustained headwind outward, easing airflow on the return, different chosen paces on the two legs.” This retains changes over time too. Writing only that the tailwind did not help enough already assumes an energy account you did not measure. Separating observation and explanation gives a clearer picture.
Route safety belongs in decisions independently of the calculation. In stronger wind on an open section, local conditions, visibility and whether the route is usable matter more than maintaining a predetermined average pace at any cost. The physical model does not decide when to go outside or how long to continue training. The chosen task must fit the actual situation.
What can you take into the next turnaround?
First, because force has a squared-speed relationship, equal wind speeds do not necessarily mean equal gains and losses. Second, force, mechanical work, power and metabolism are separate quantities. Third, add times separately for equal-length sections covered at different paces. These three steps already help identify many misleading wind corrections.
A tailwind section can feel pleasant without exactly repaying every earlier effort. A windy loop’s value is not determined only by seconds compared with a still-air record. Accurately described conditions, pace chosen for the task and your own experience together make the session useful. The model serves well when it helps explain this run without promising more than we calculated.
Sources
- NASA Glenn Research Center: the basic drag equation.
- Jenny and Jenny: an analytical model of running’s mechanical components.
- Yamashita and colleagues: wind direction, airspeed and physiological responses.
- Knechtle and colleagues: observational analysis of weather and Boston Marathon finishing times.
How Futószív articles are prepared: our editorial guidelines.